UI Screenshots
Screenshots of all MoE Sovereign web interfaces. Generated automatically via Playwright.
Admin UI
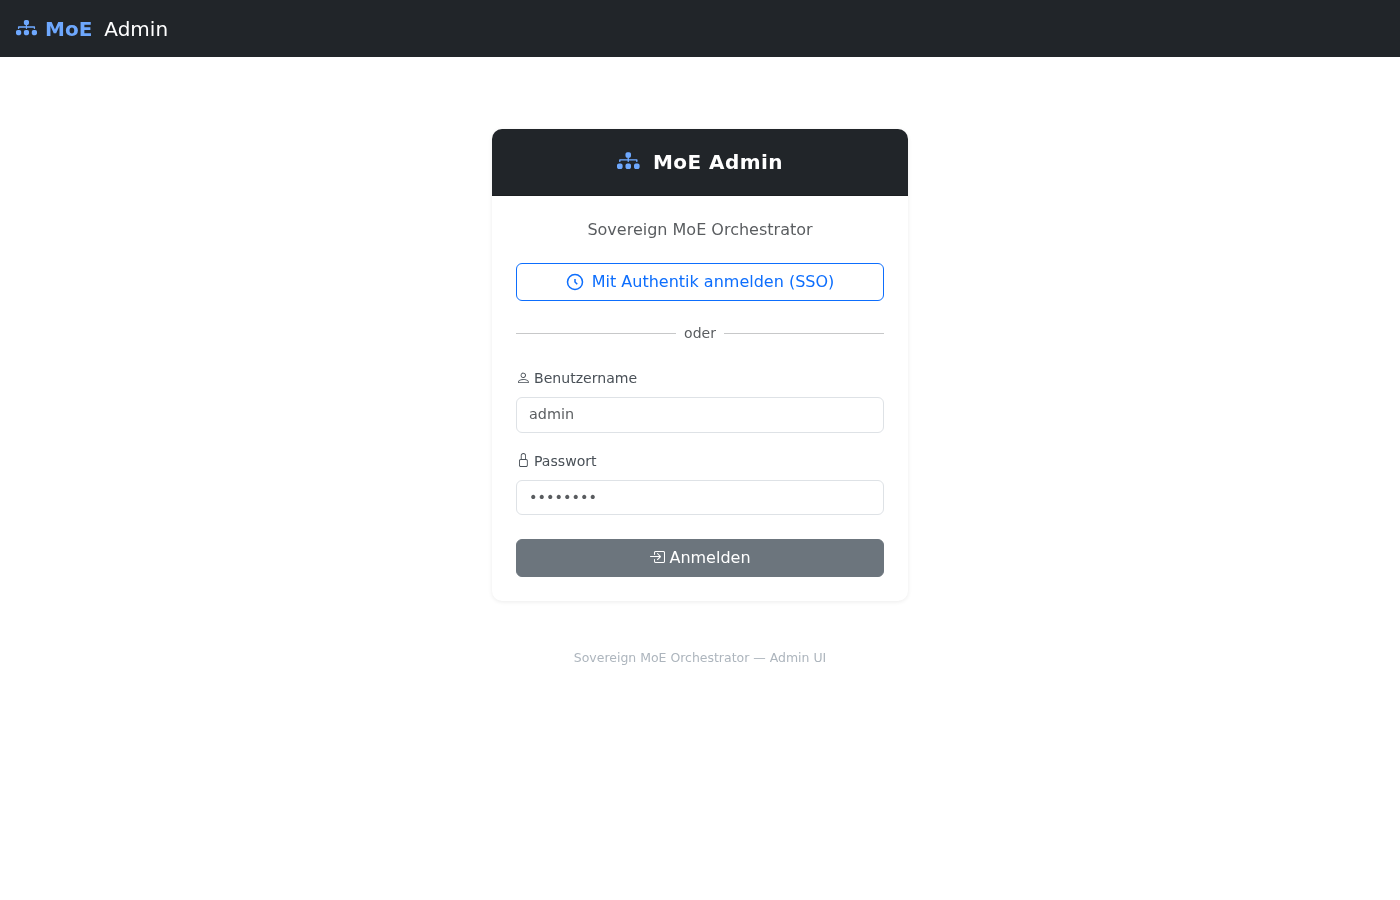
Login
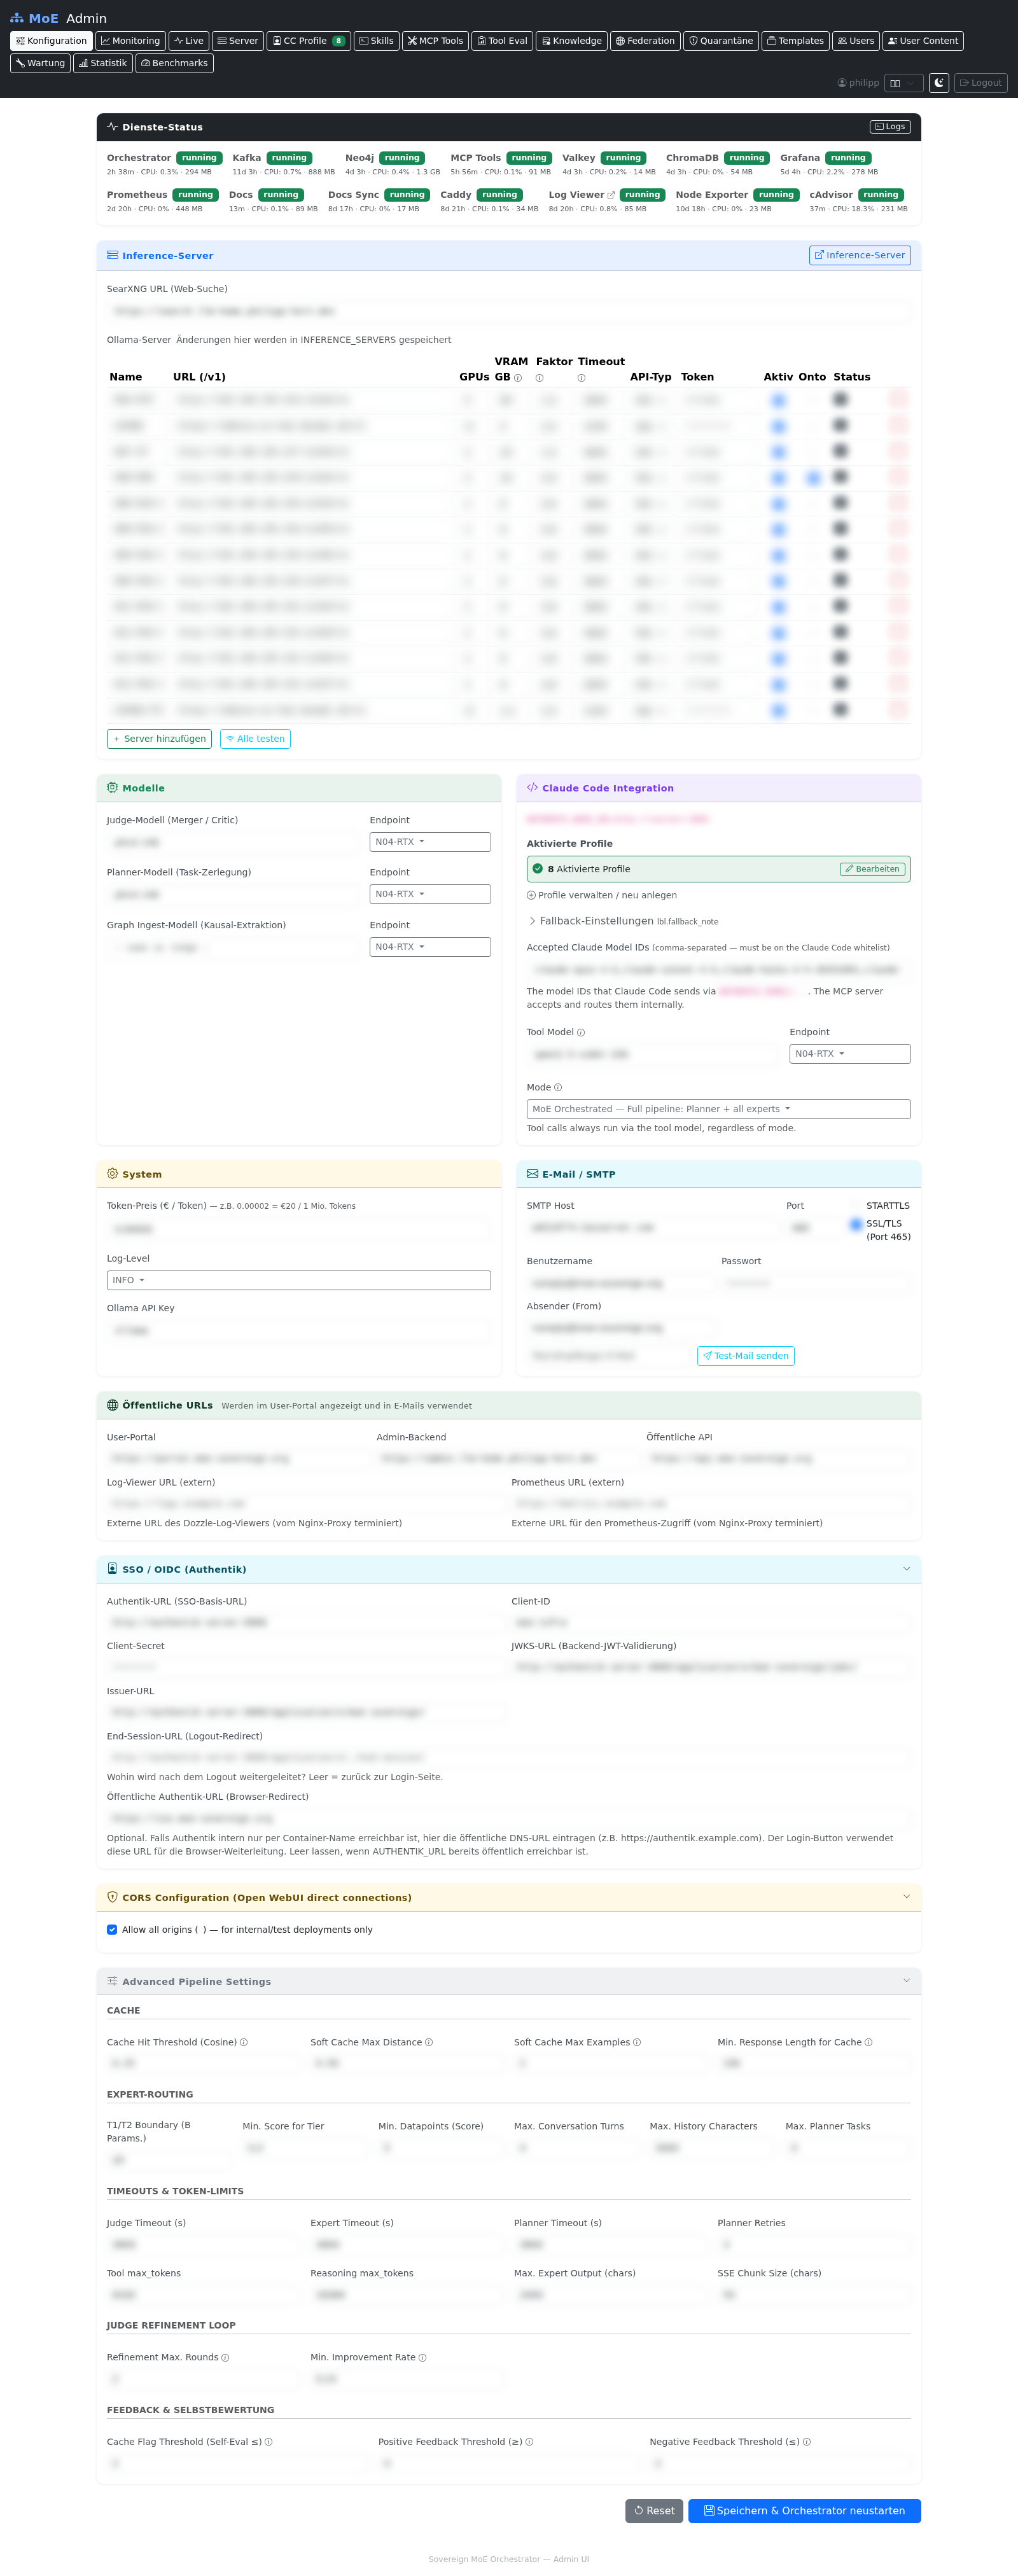
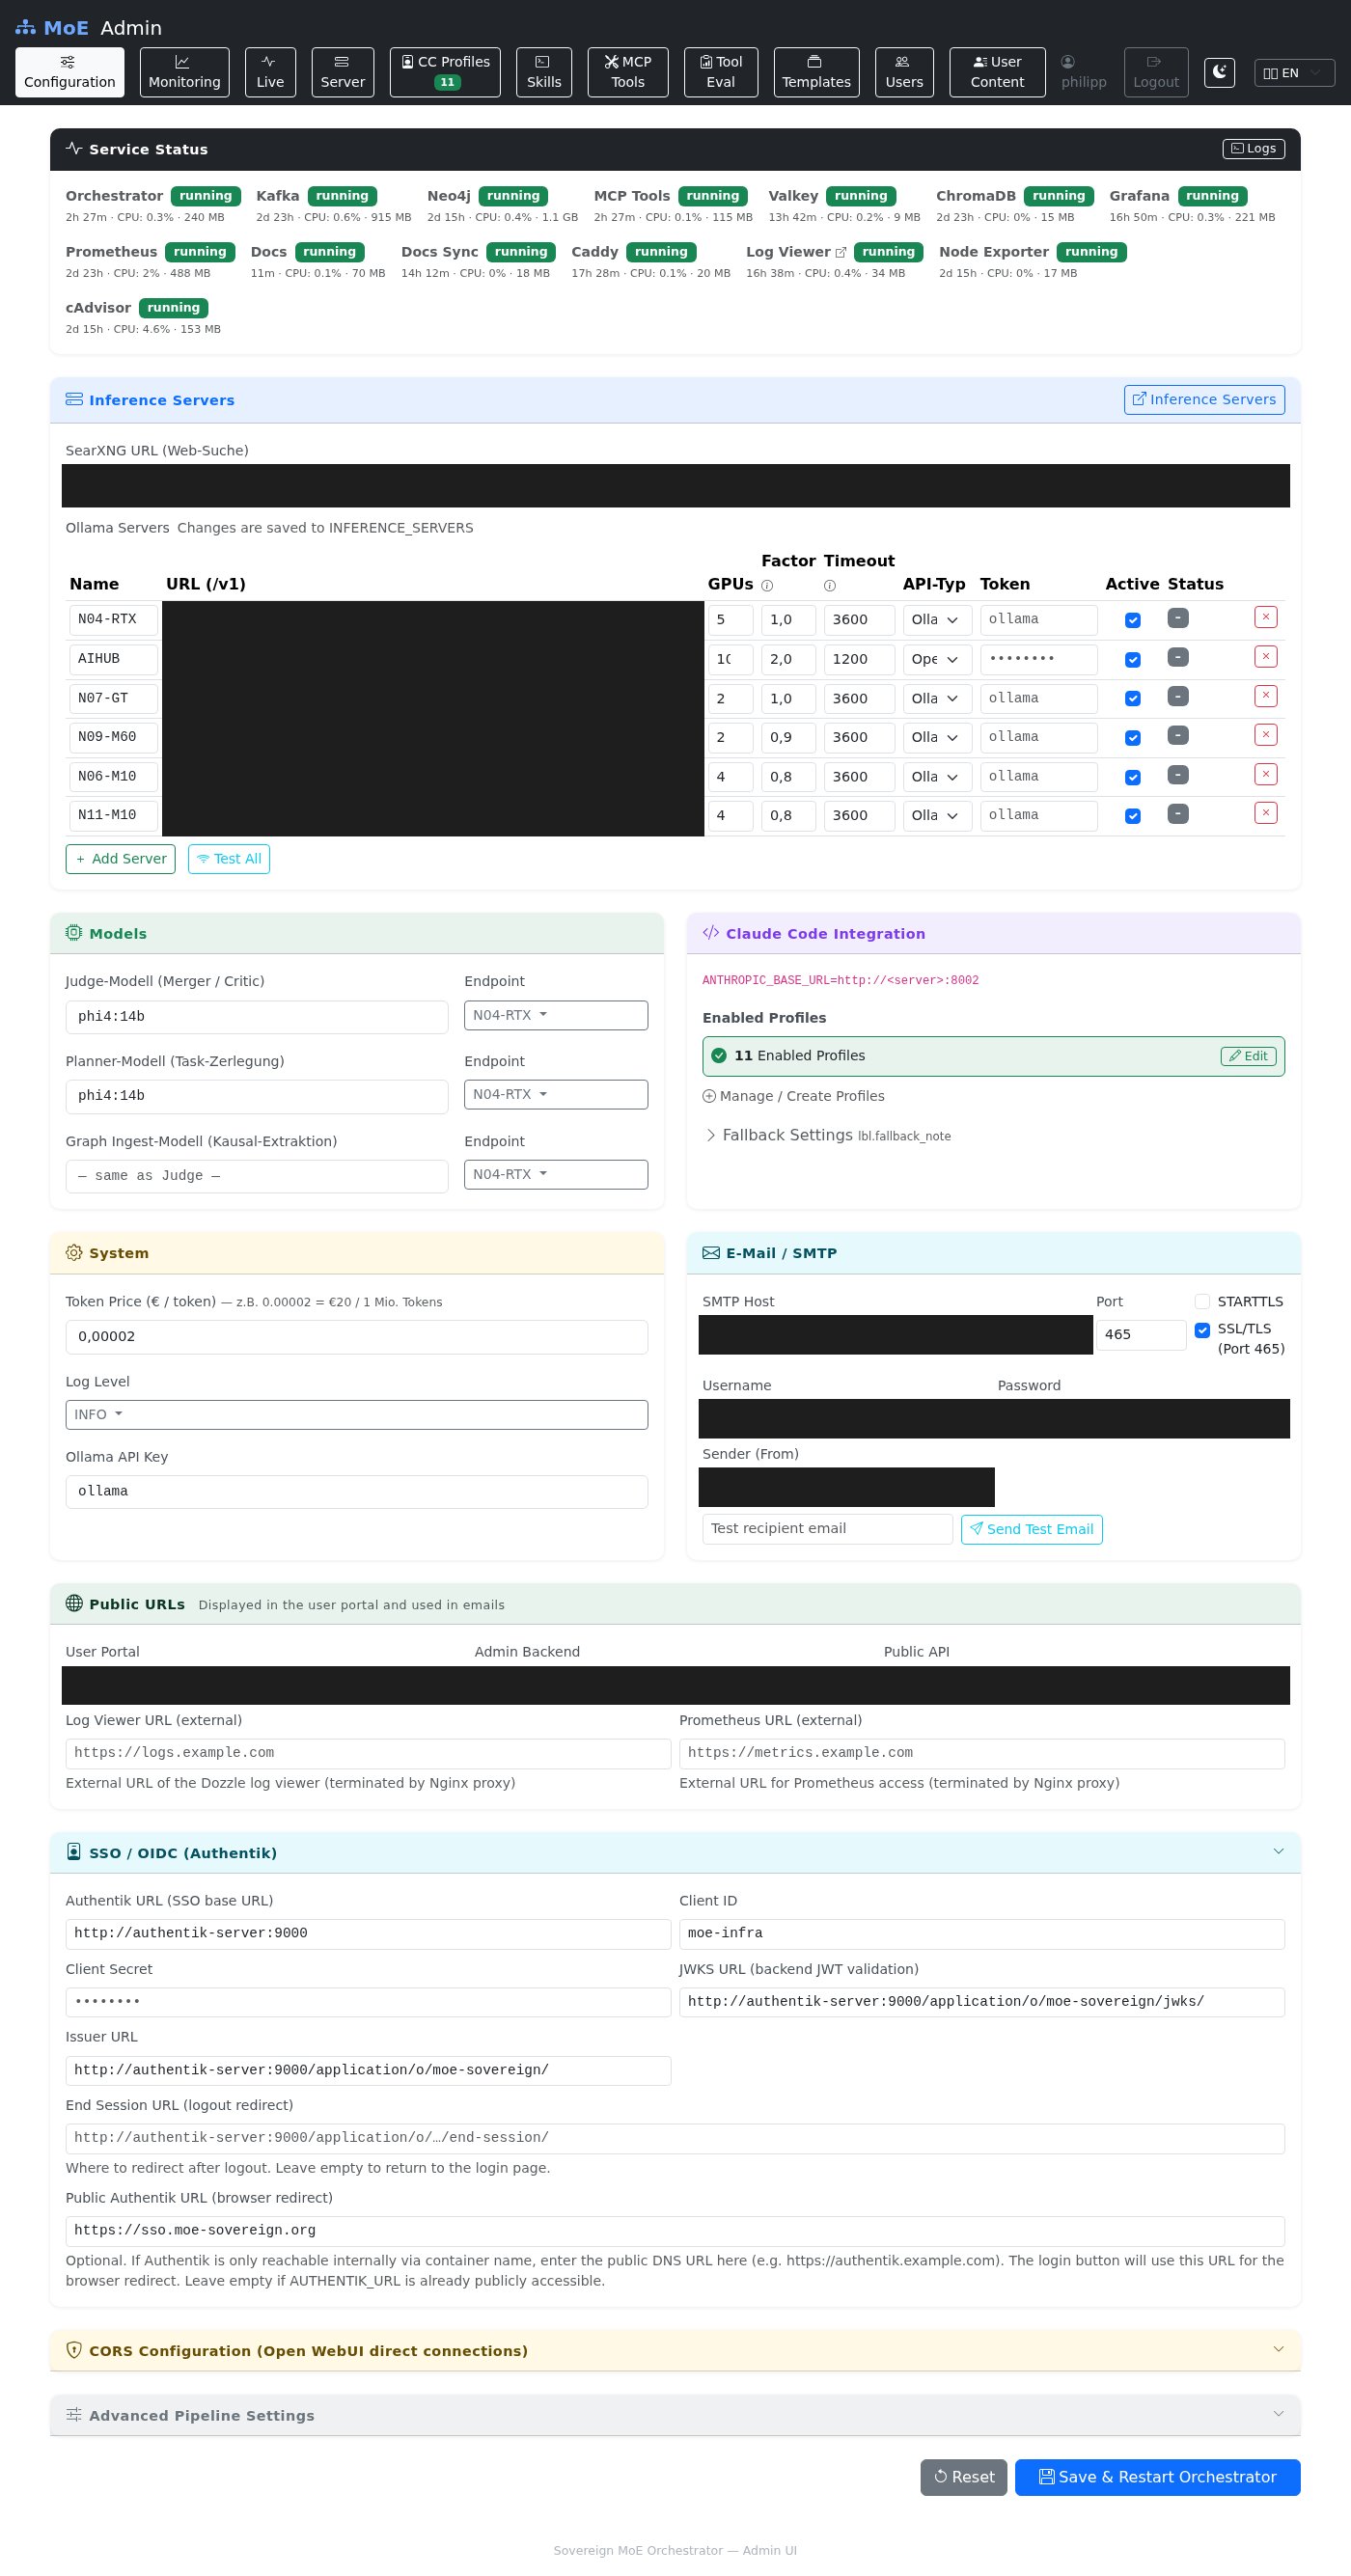
Dashboard — Full Overview (with Advanced Pipeline Settings)
Full-page screenshot of the Admin UI dashboard including all configuration sections: server tiles, model routing, SMTP, OIDC, CORS, and the expanded Advanced Pipeline Settings block. All sensitive fields (URLs, credentials, API keys, server names) are privacy-blurred.
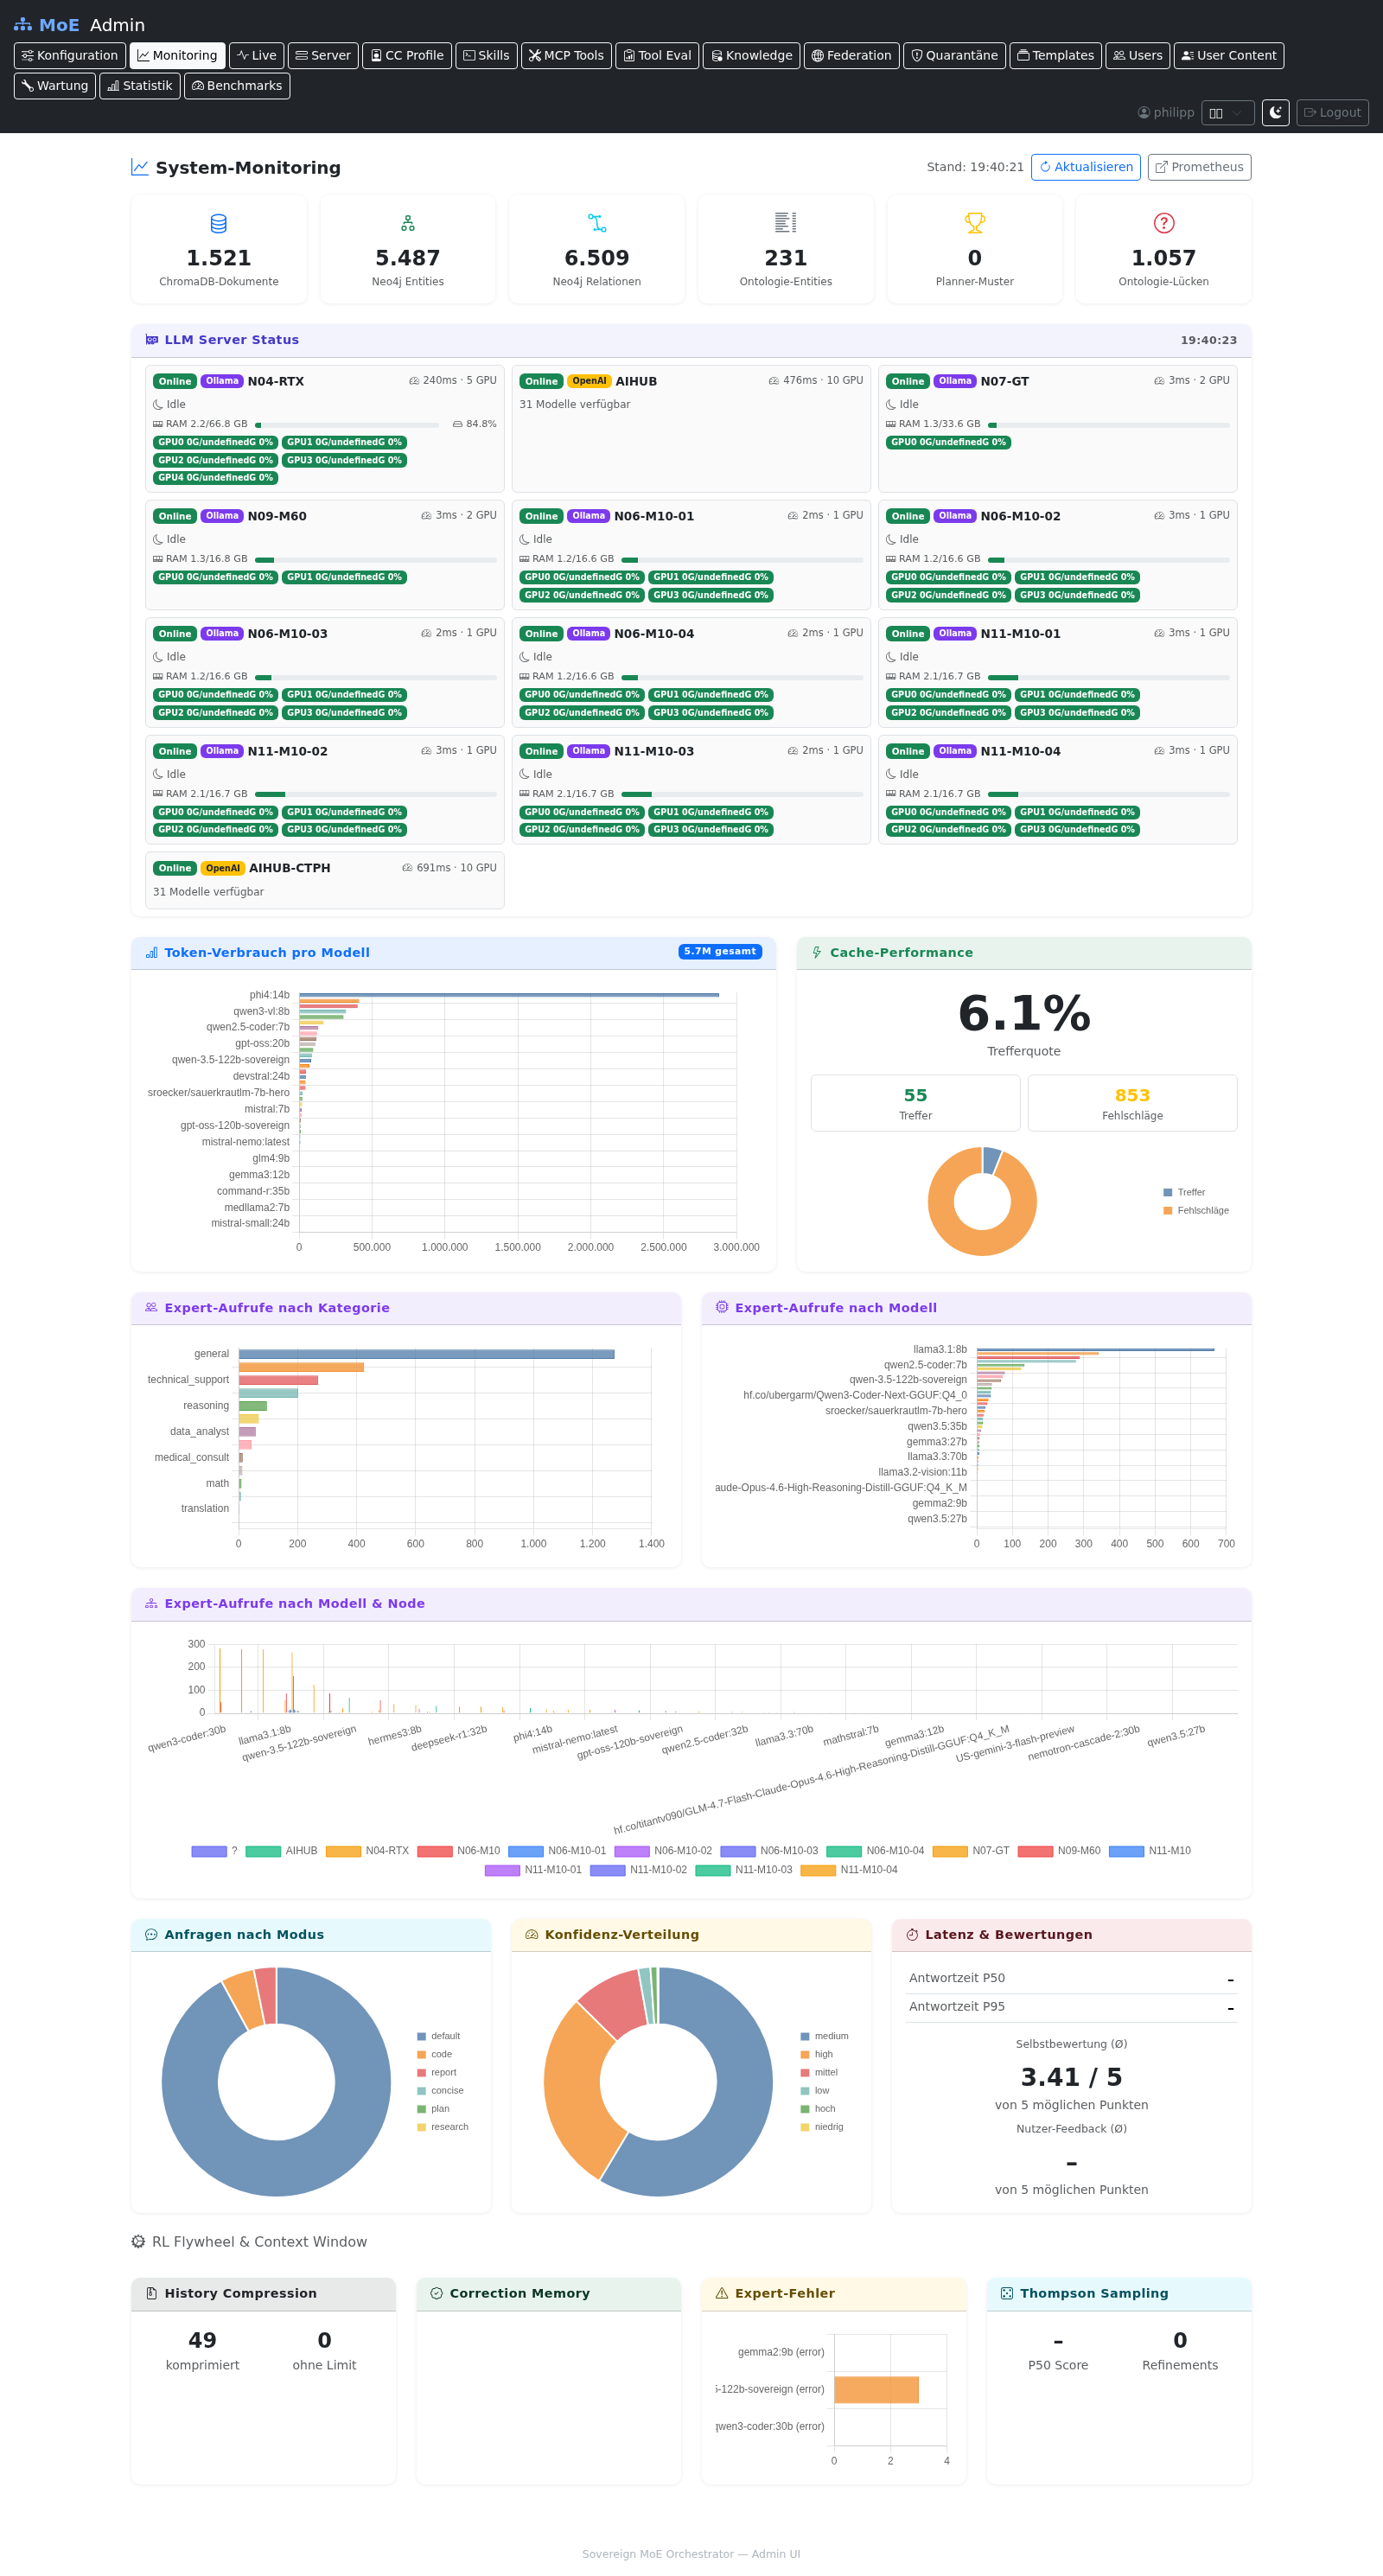
Live Monitoring
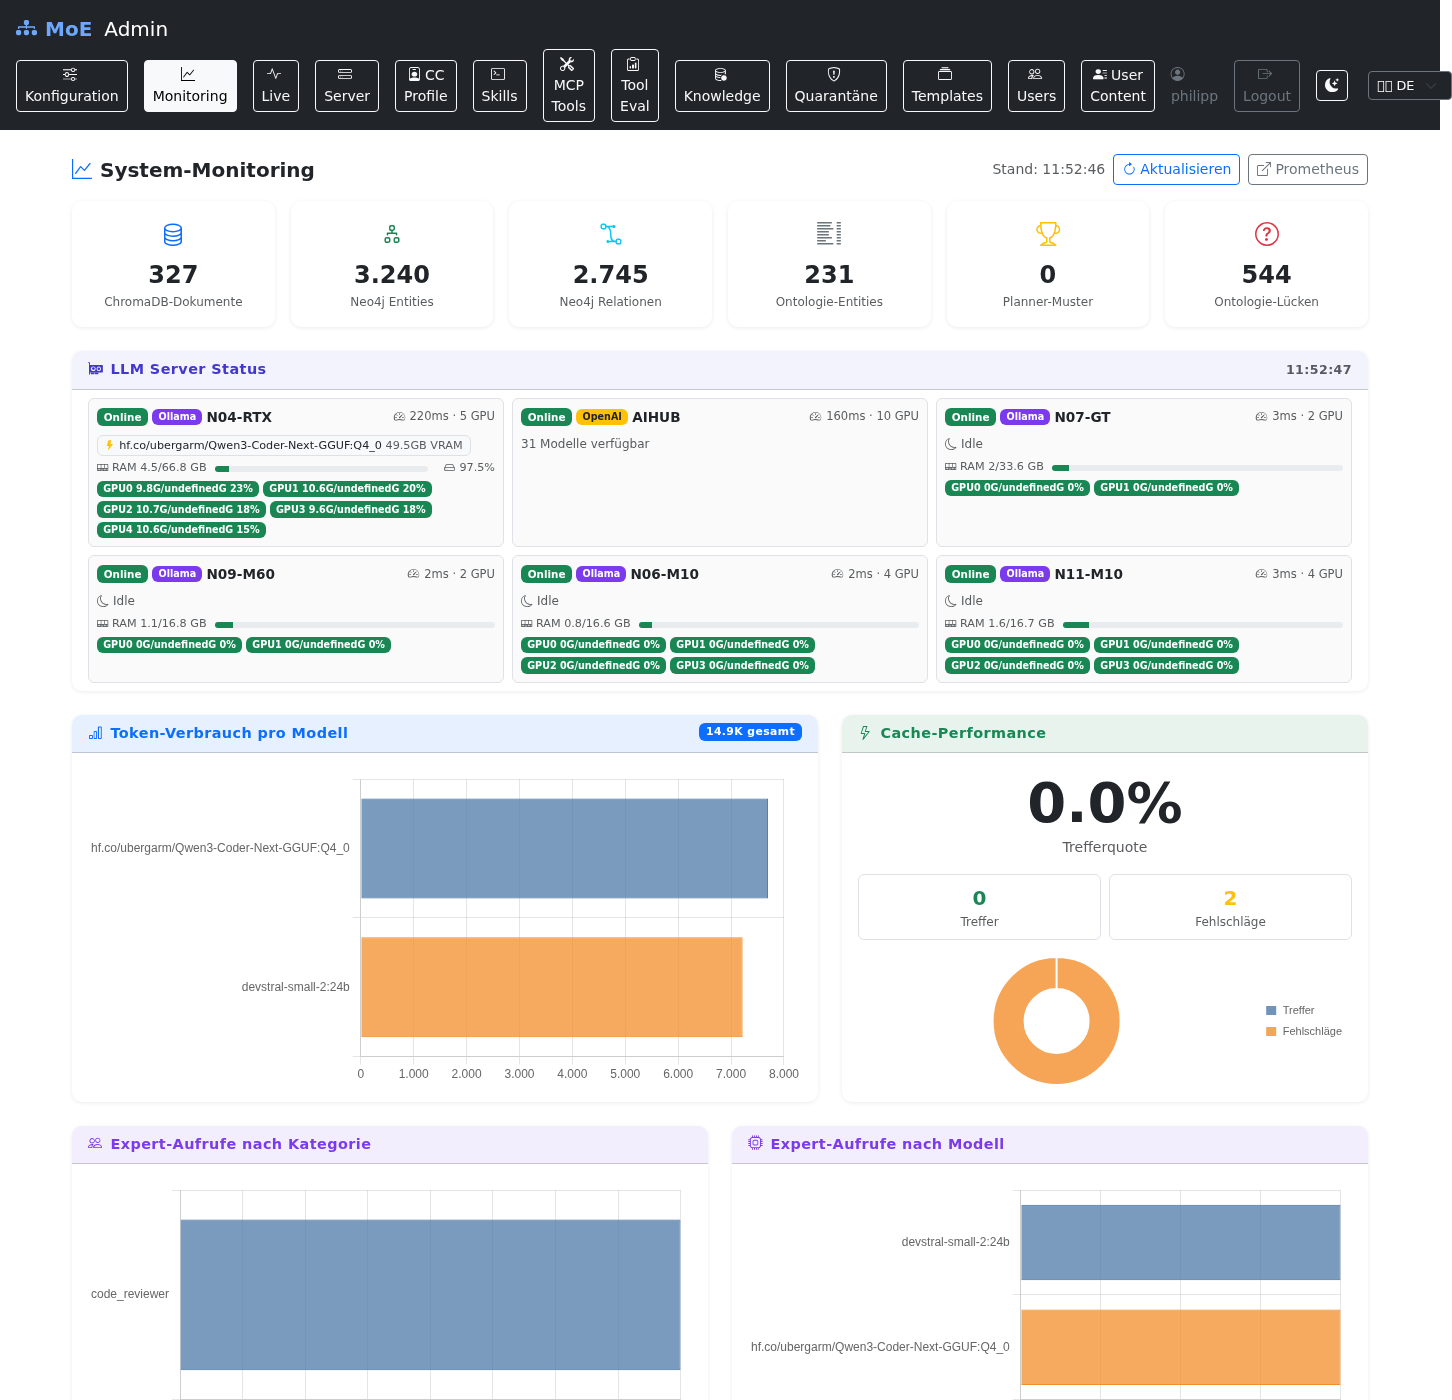
Full-page screenshot of the monitoring view showing per-node GPU utilisation, inference throughput, memory occupancy, and the gap-healer slot counters. Server tiles wait for the background health-check to complete before capture.
Dashboard — System Configuration
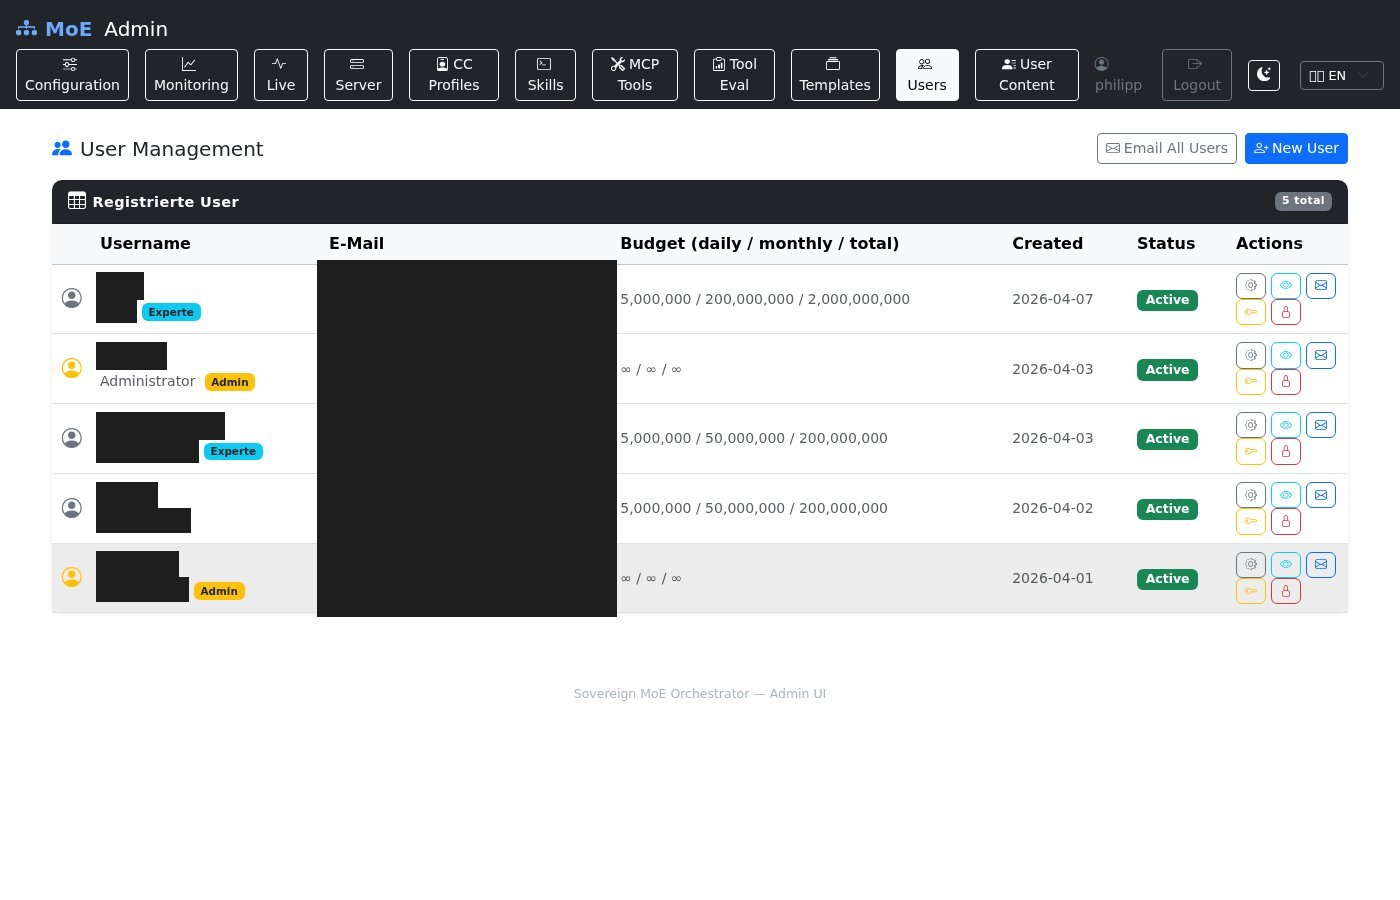
Users & Roles
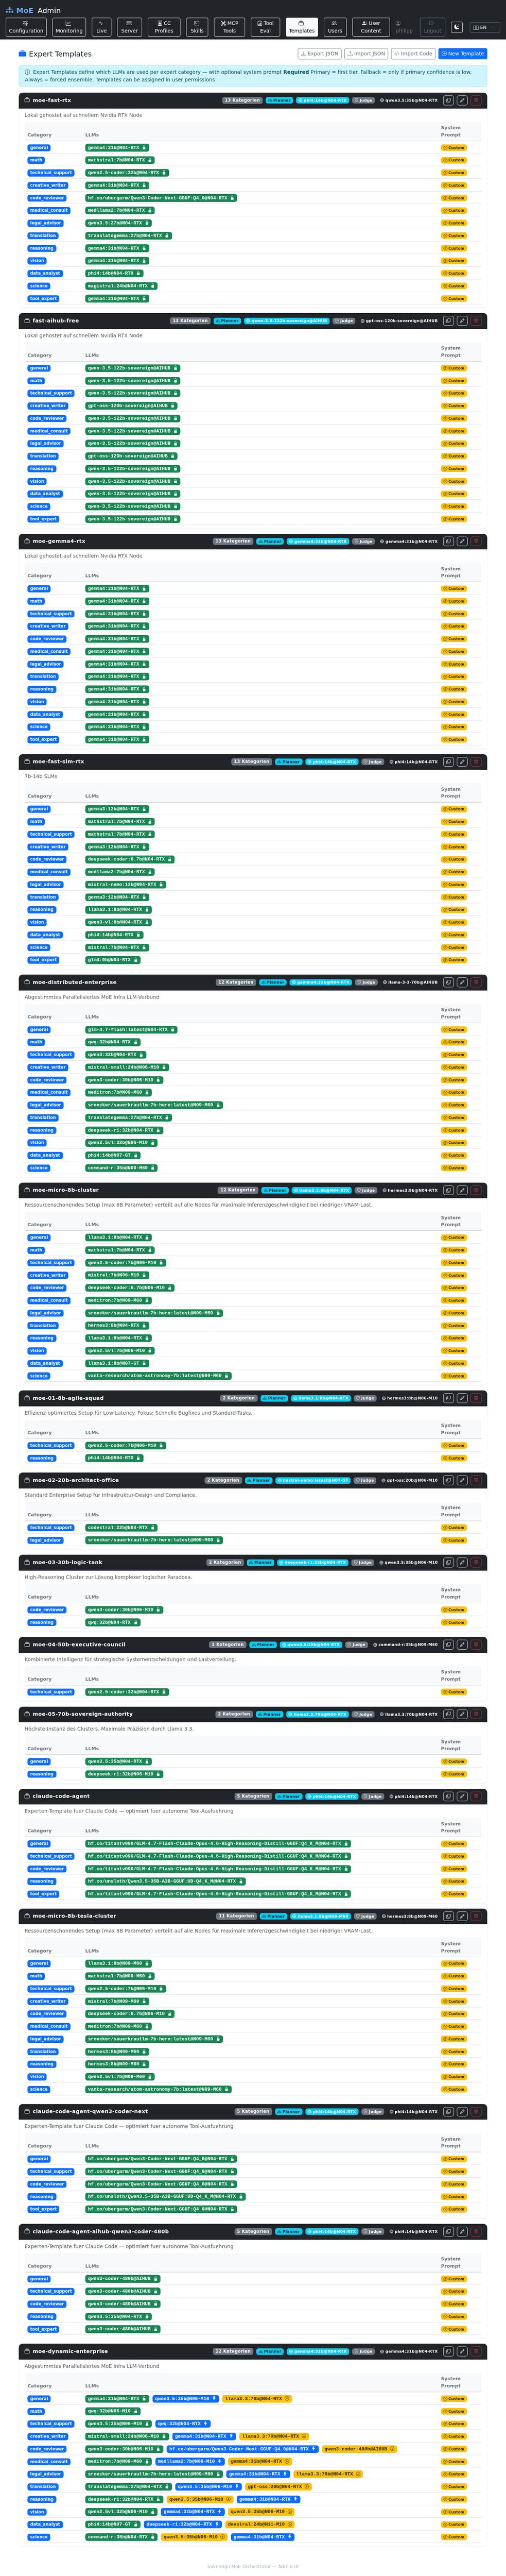
Expert Templates
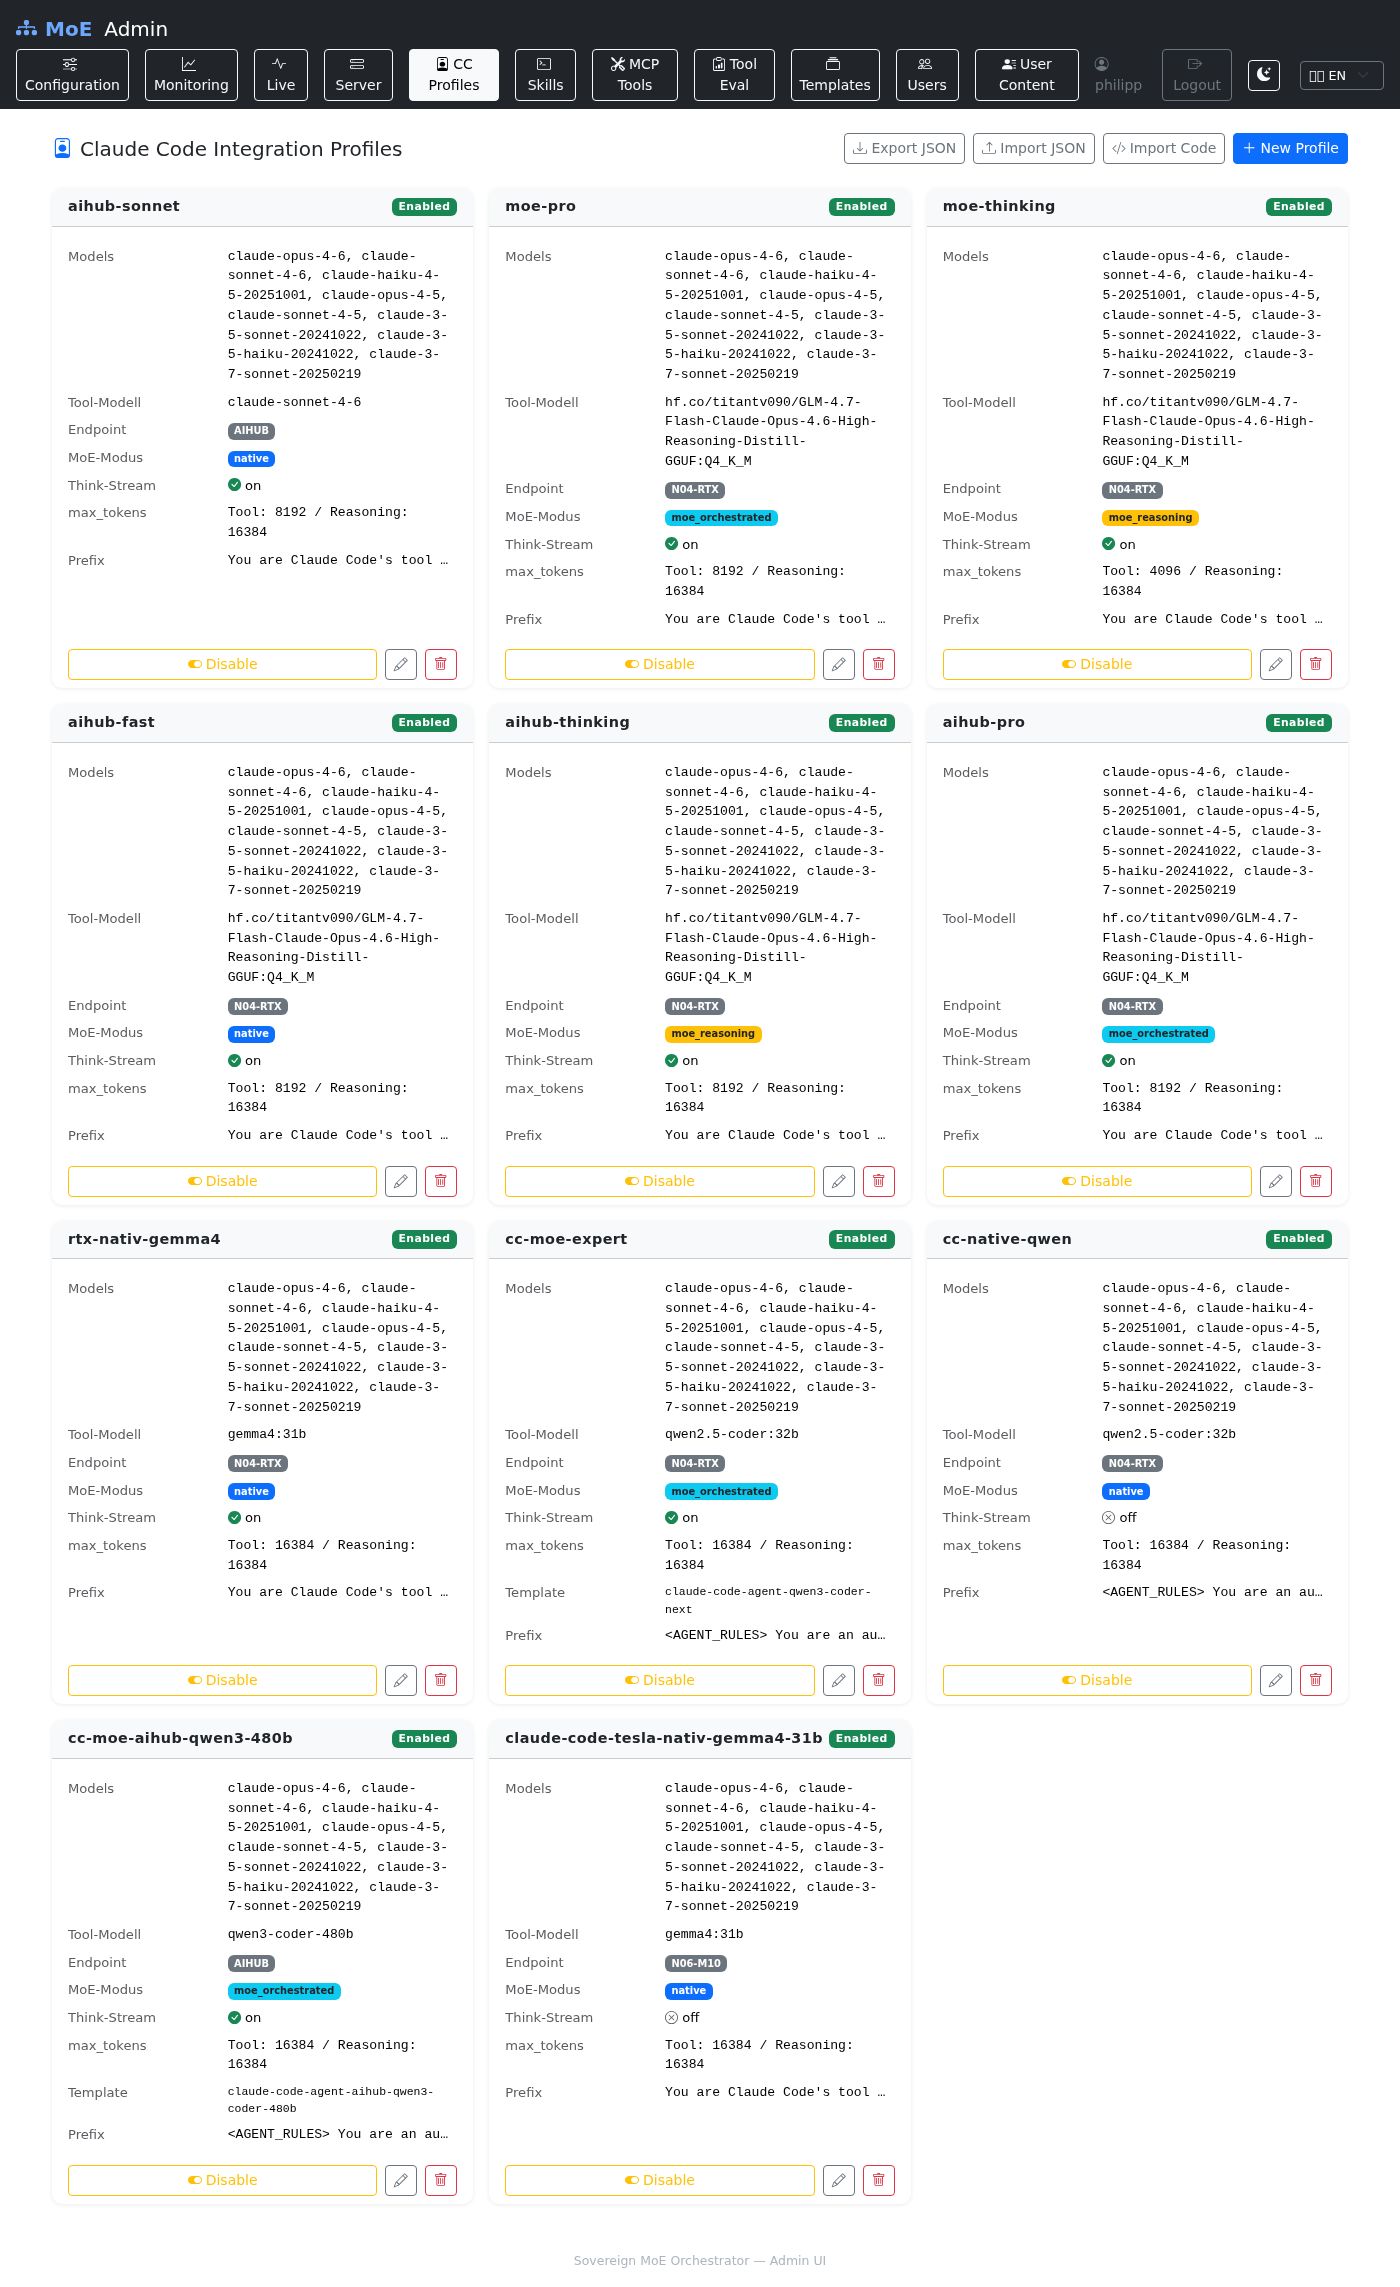
Claude Code Profiles
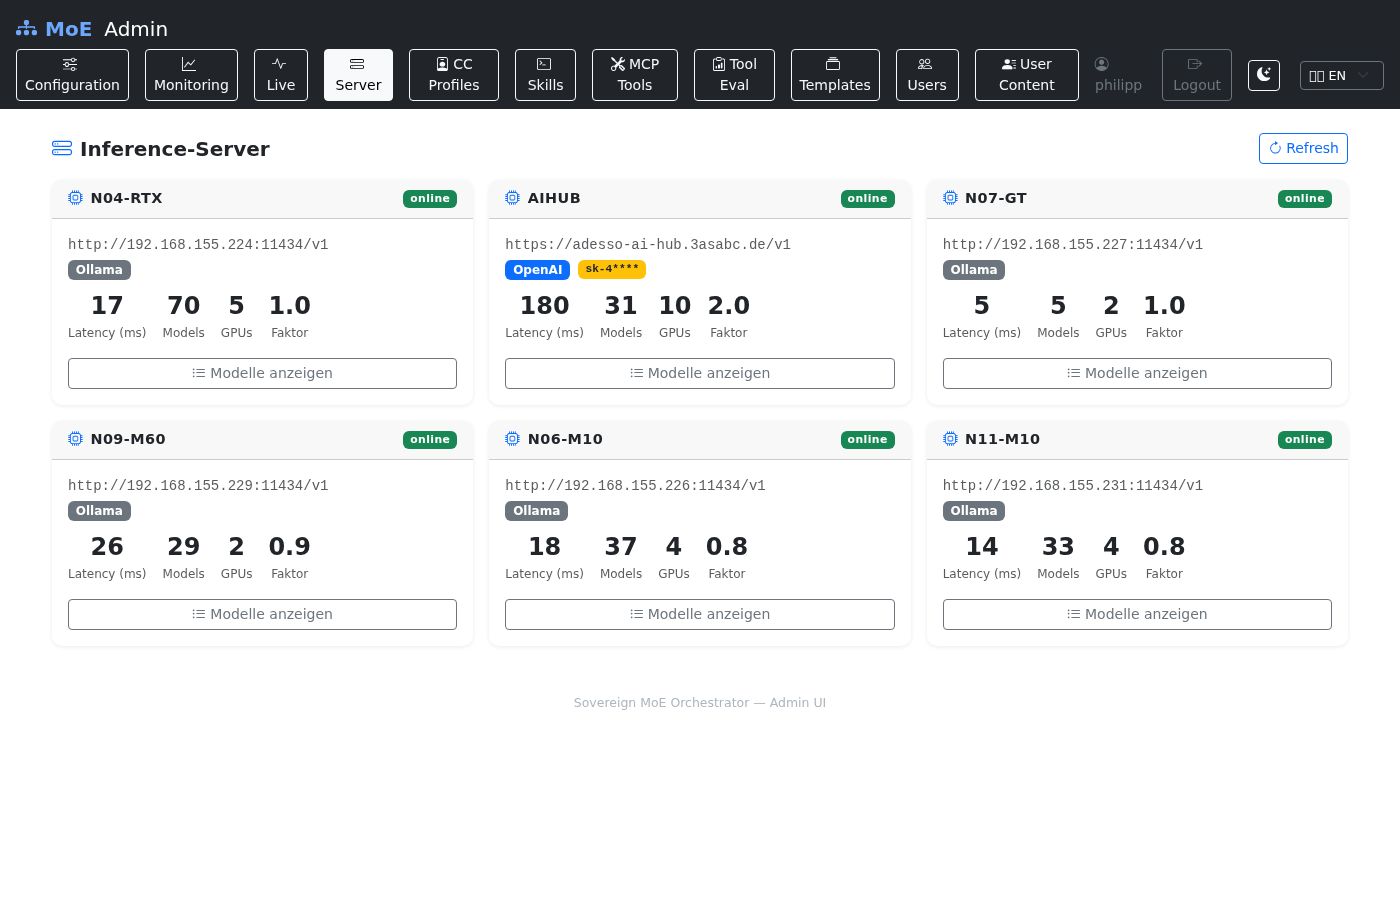
Inference Servers
System Monitoring (legacy)
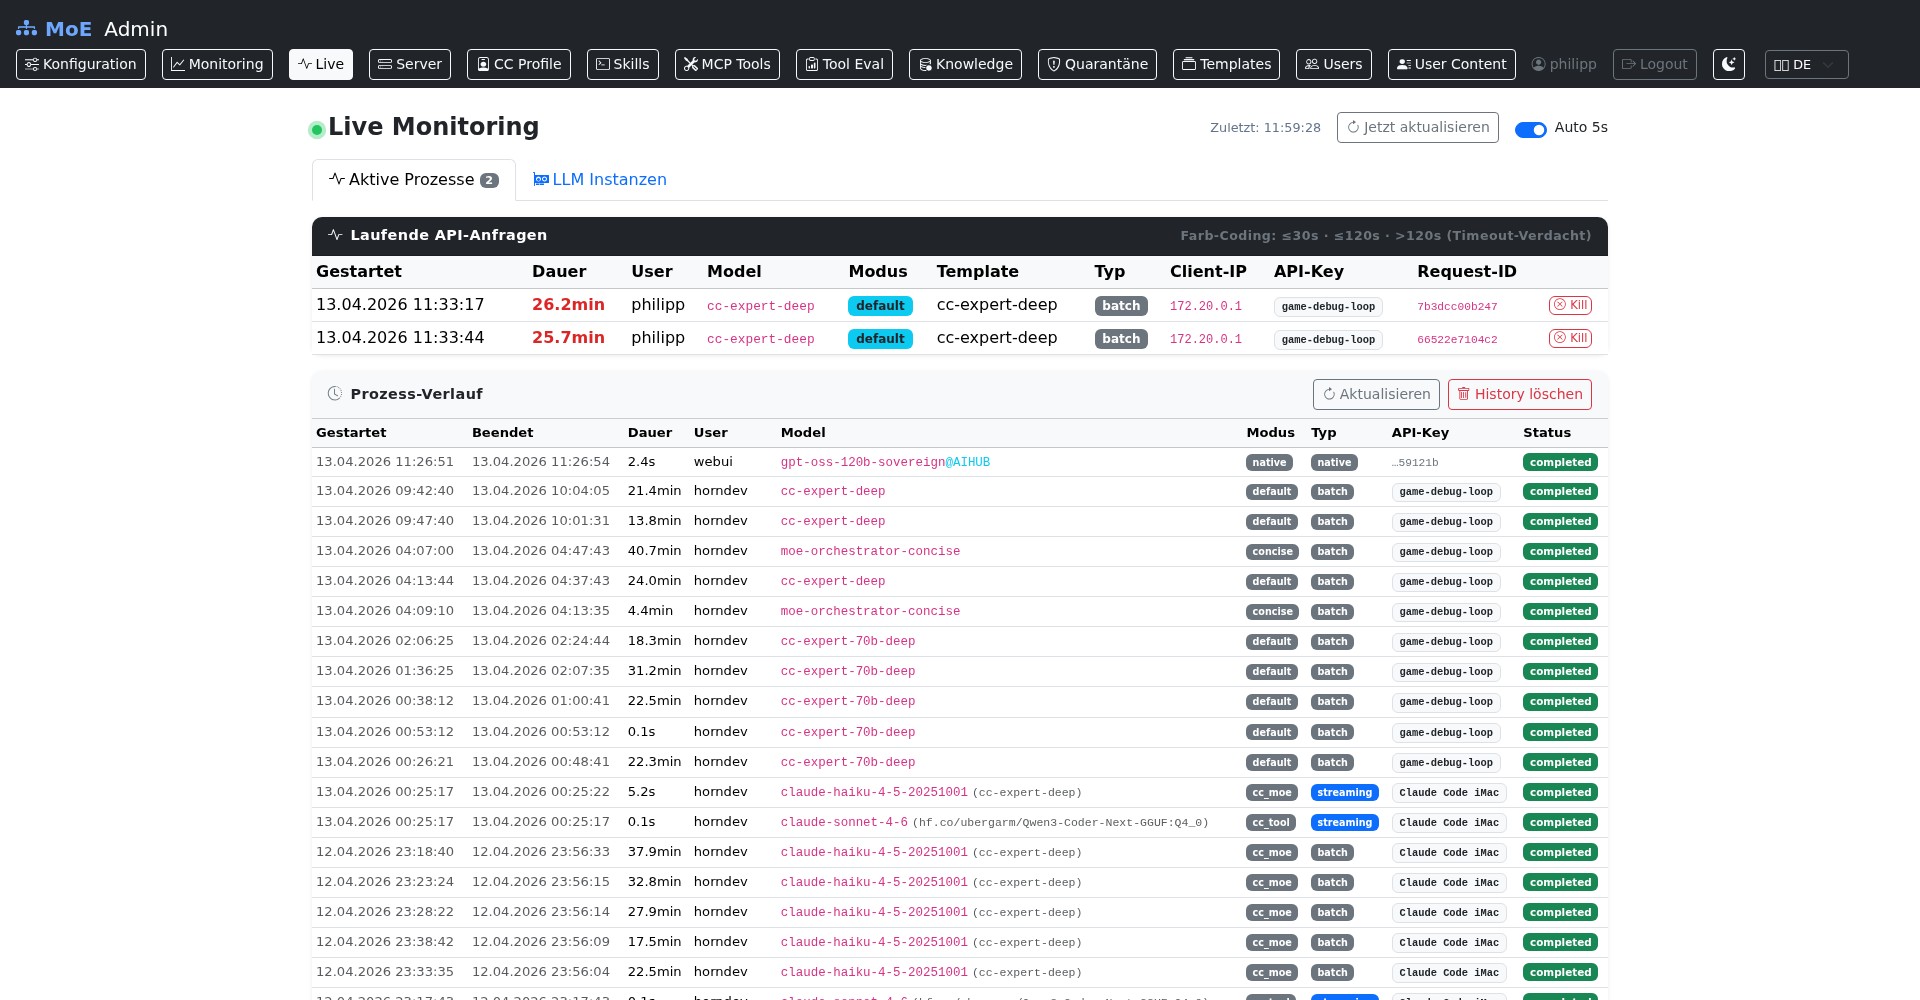
Live Monitoring — Process History
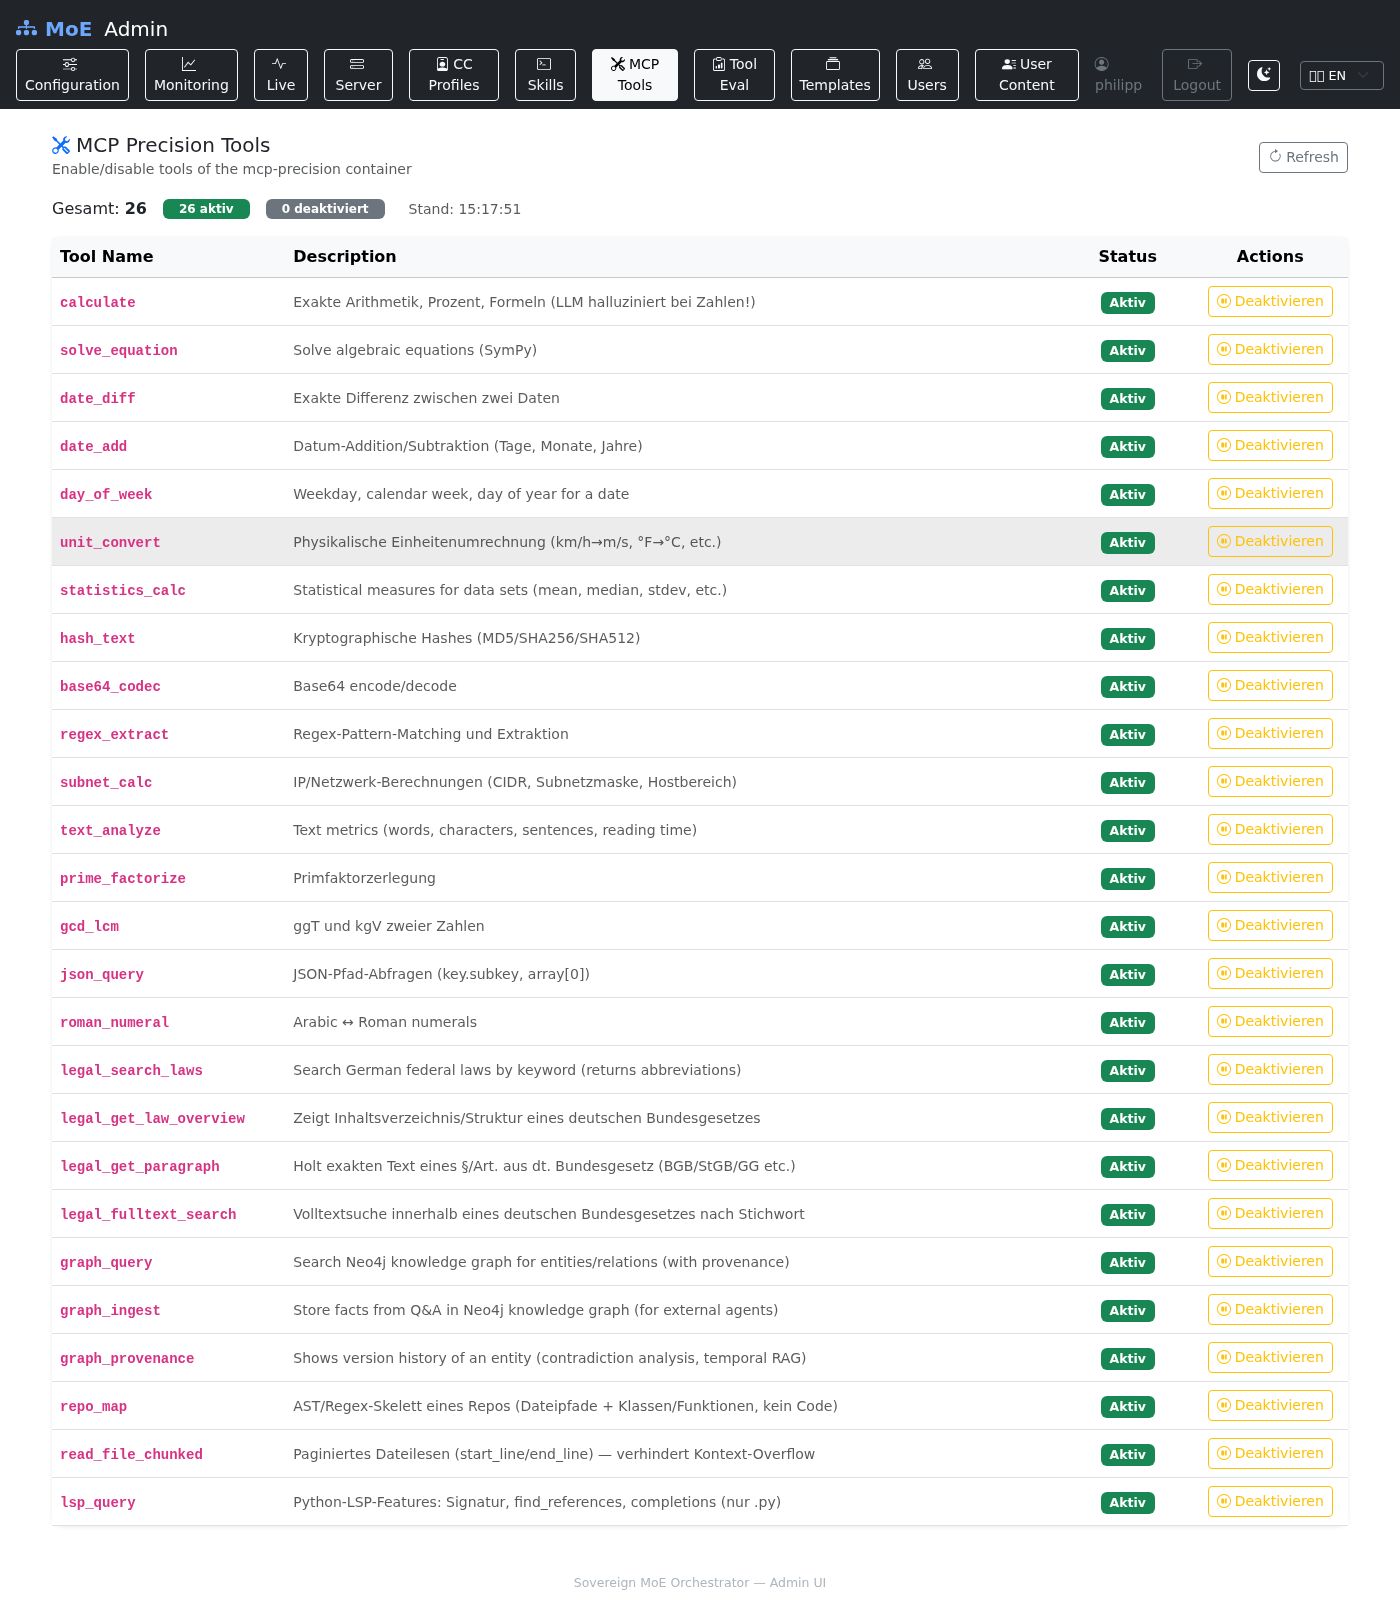
MCP Precision Tools
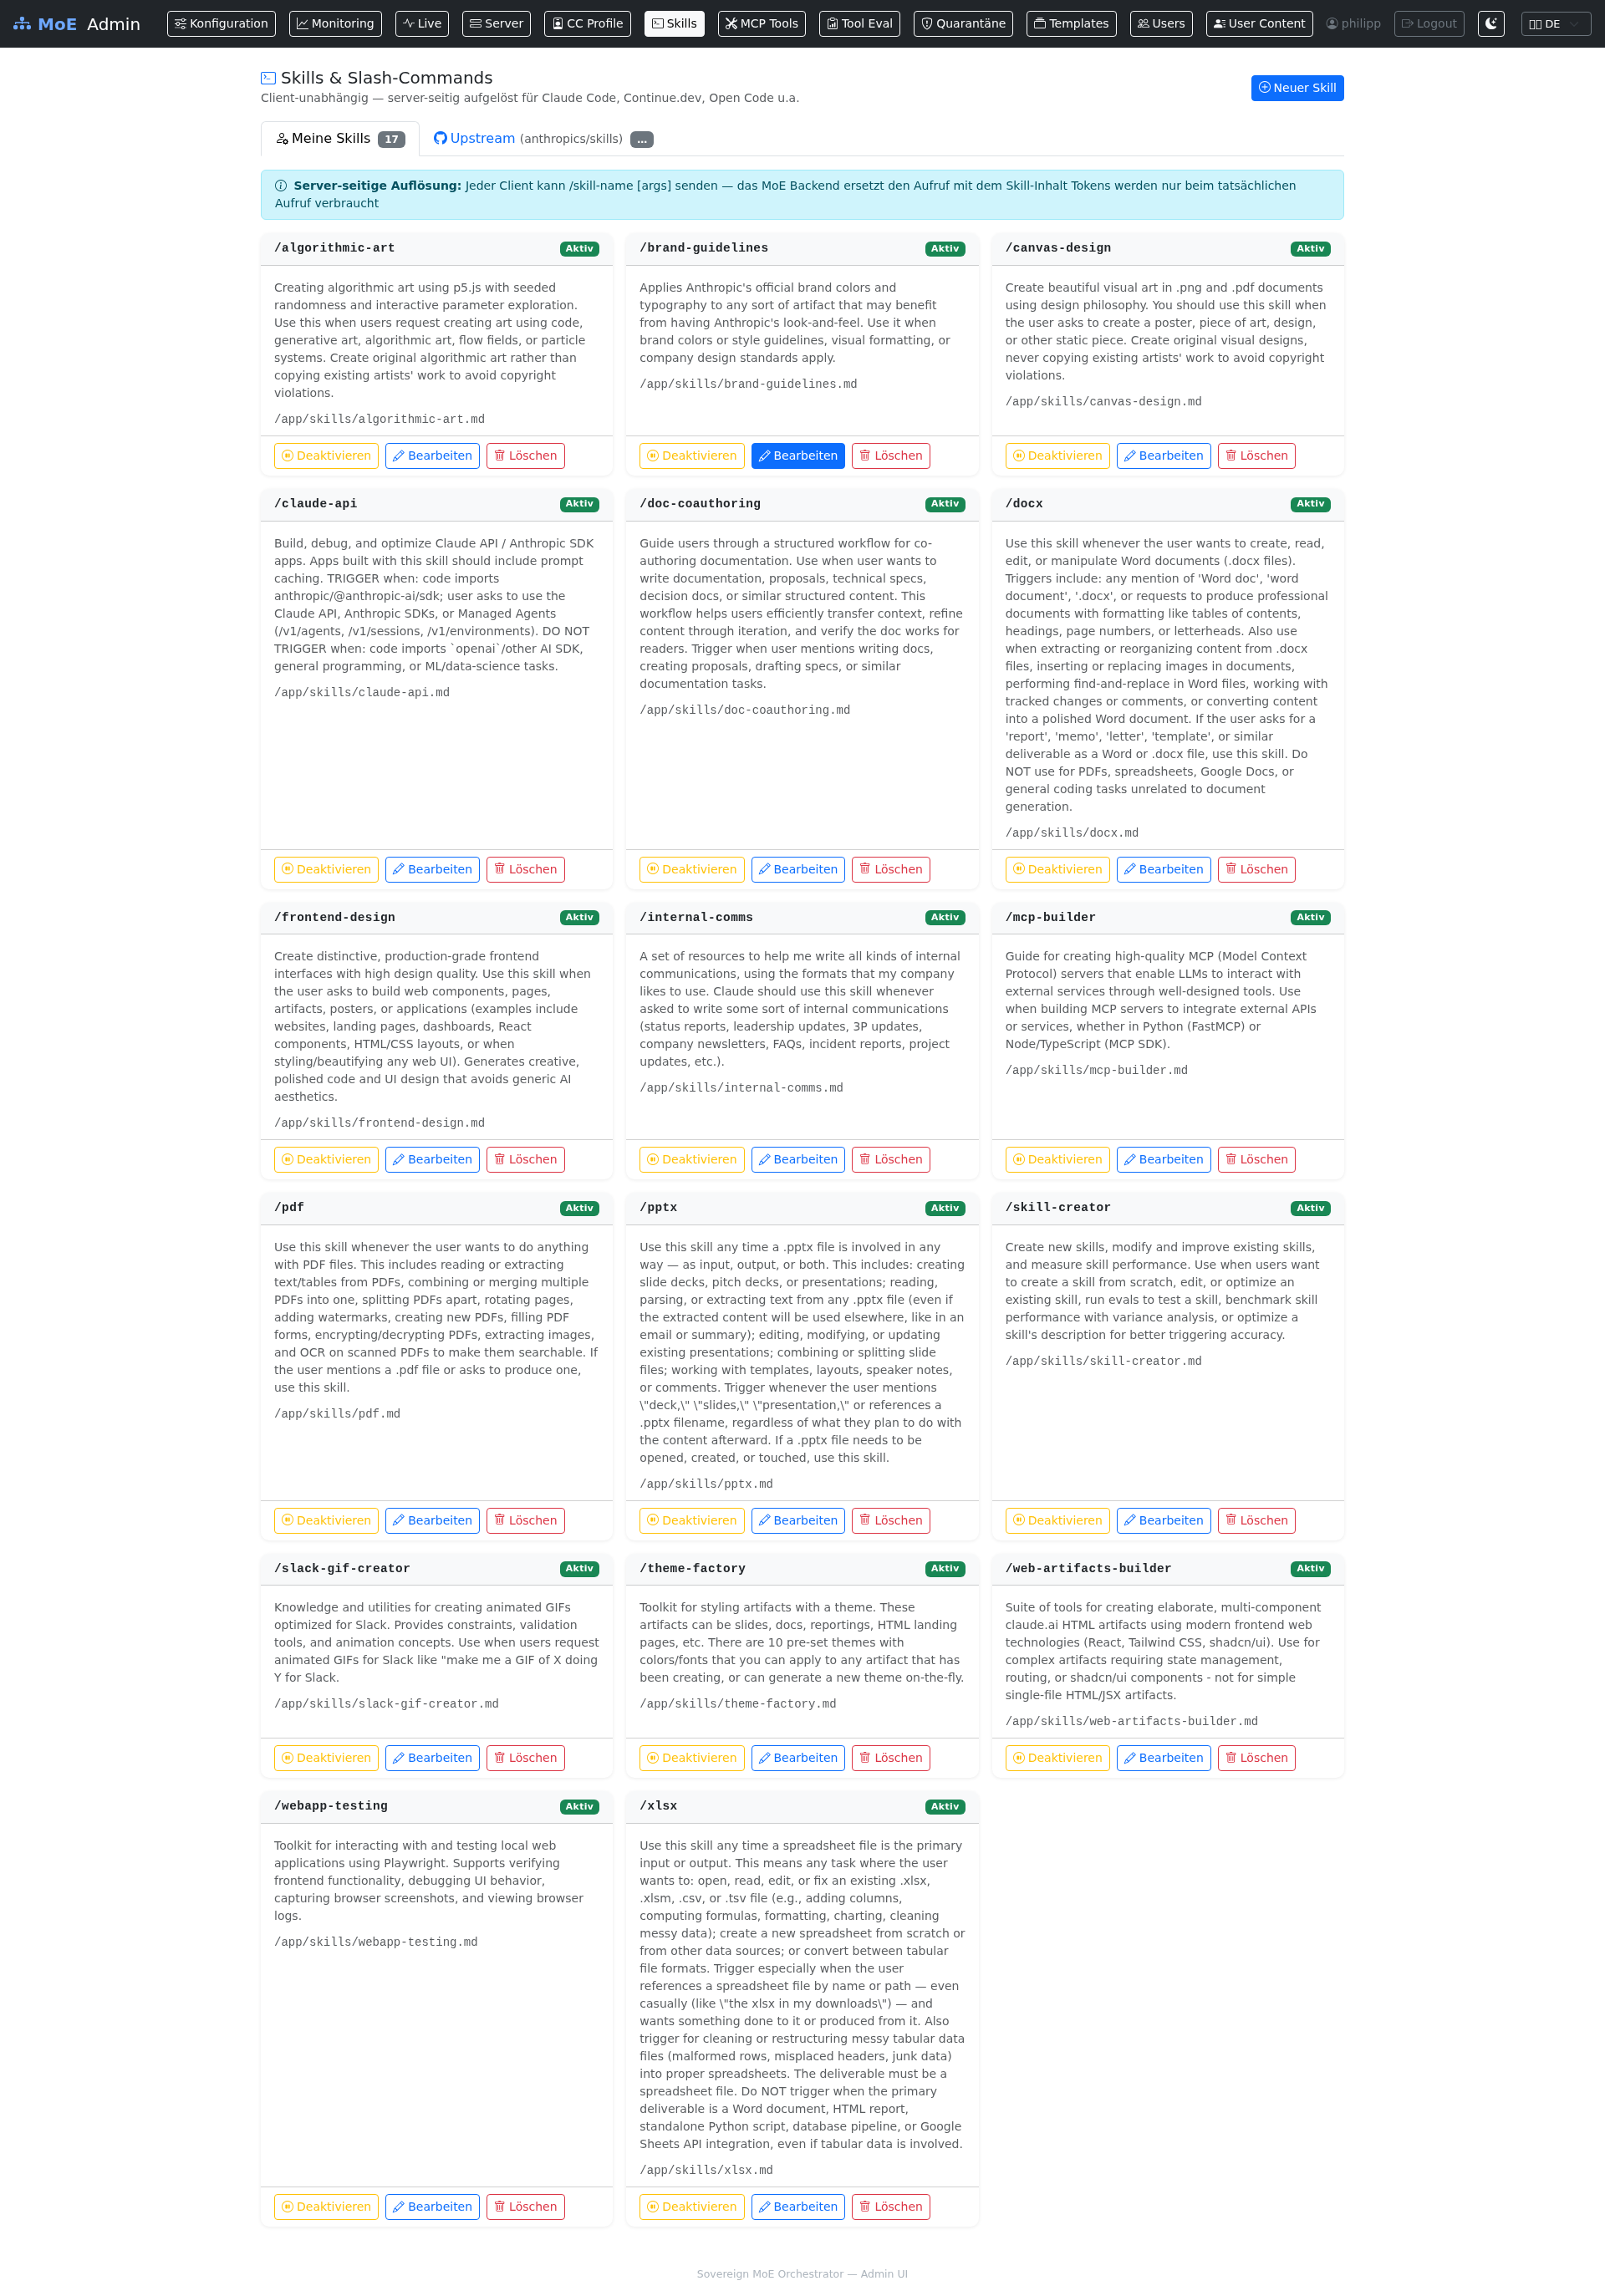
Skills
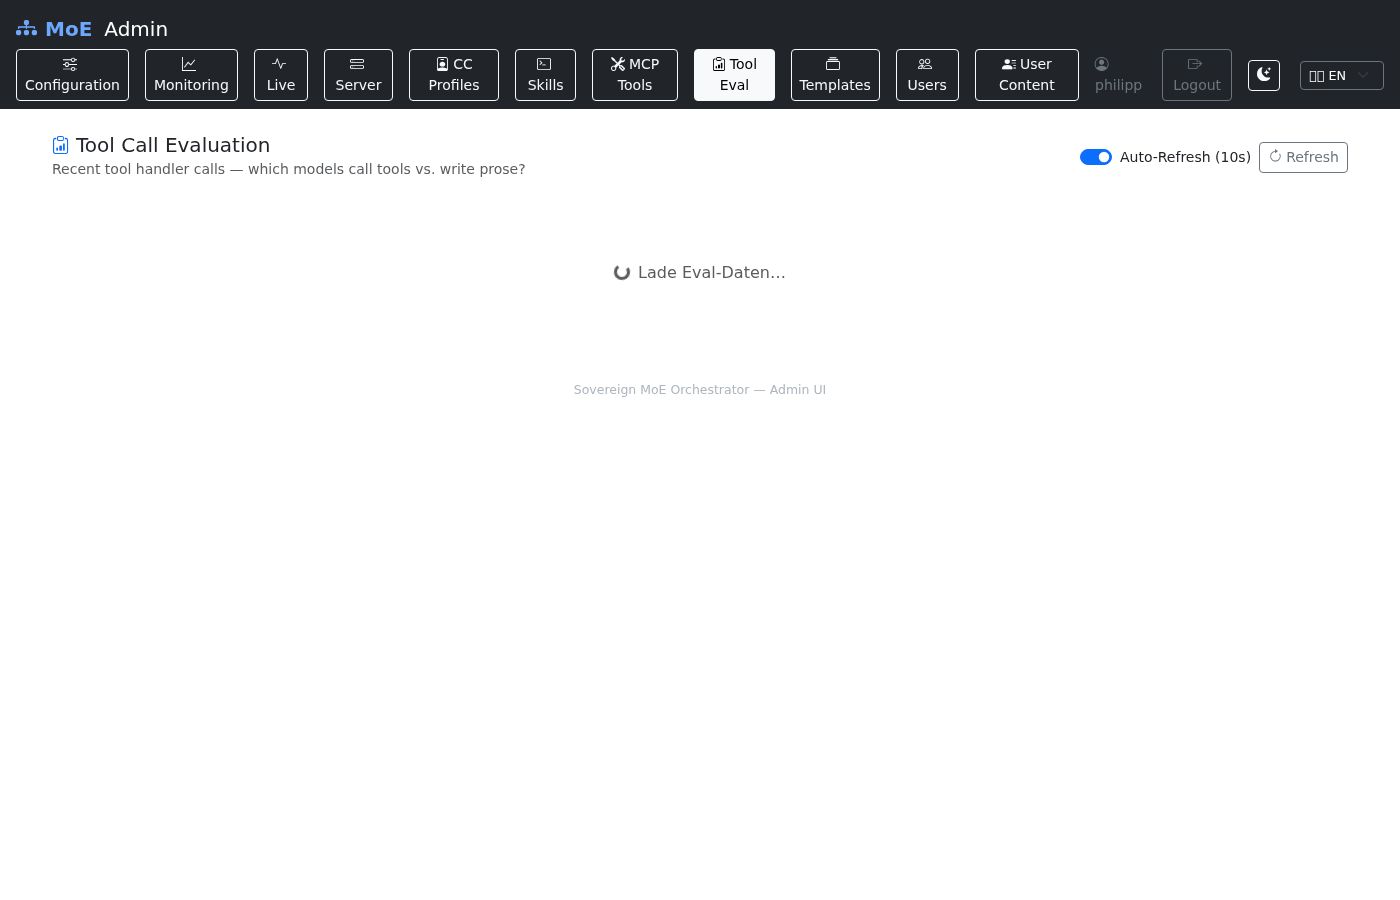
Tool Evaluation Log
Grafana Dashboards
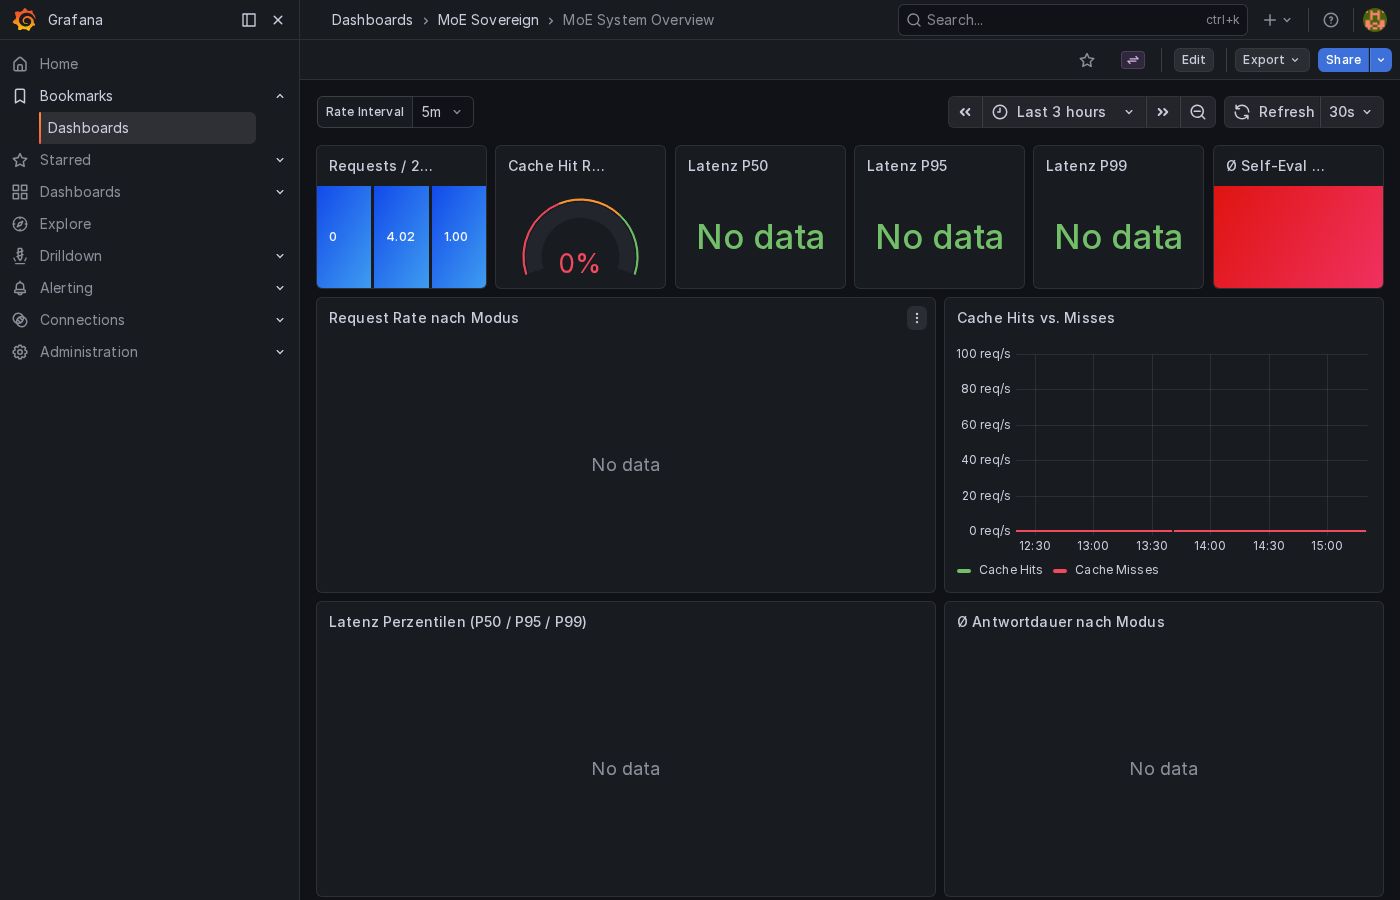
MoE System Overview
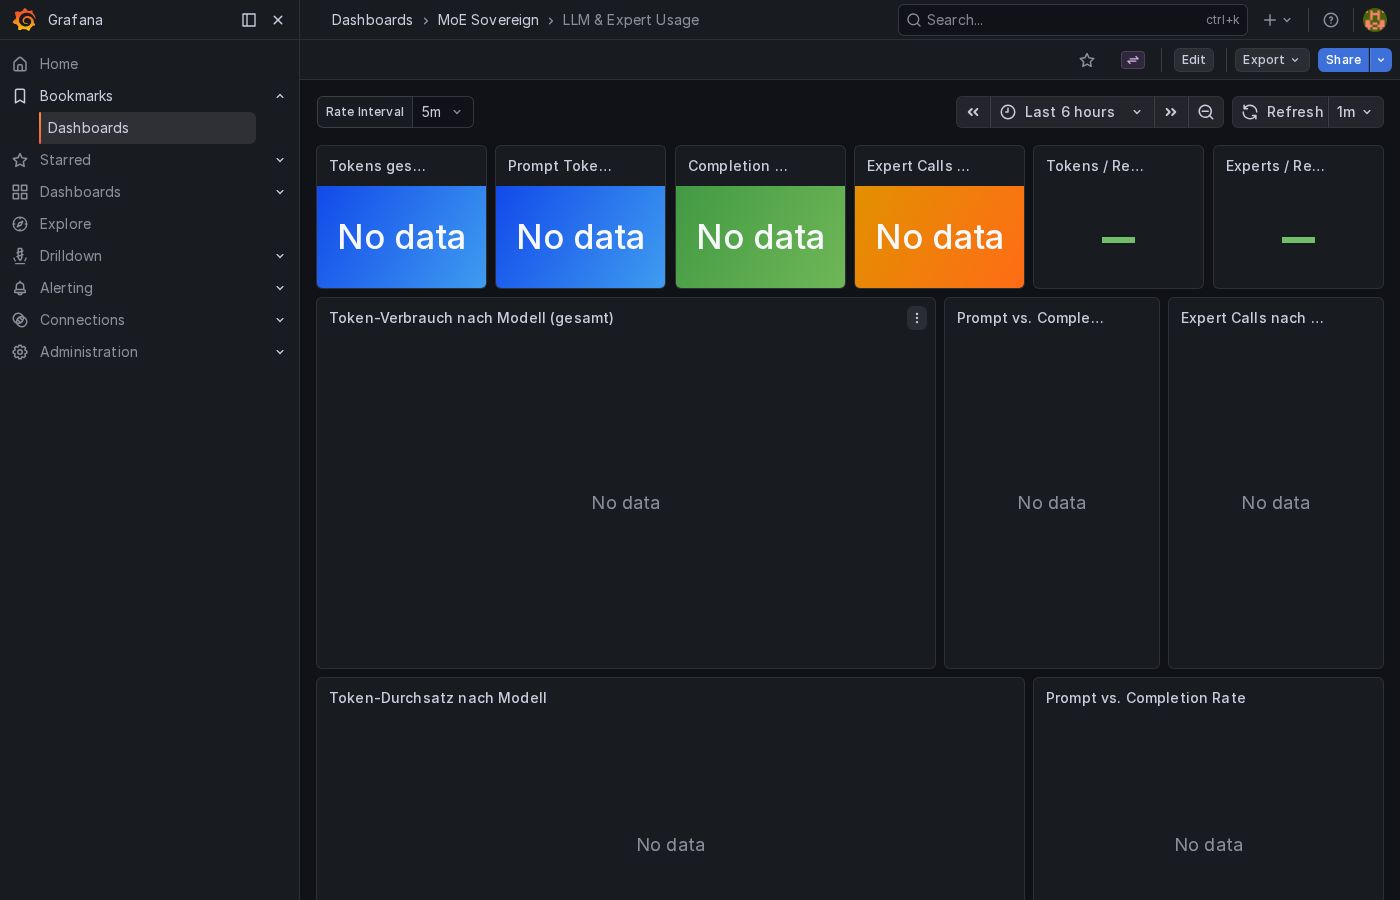
LLM & Expert Usage
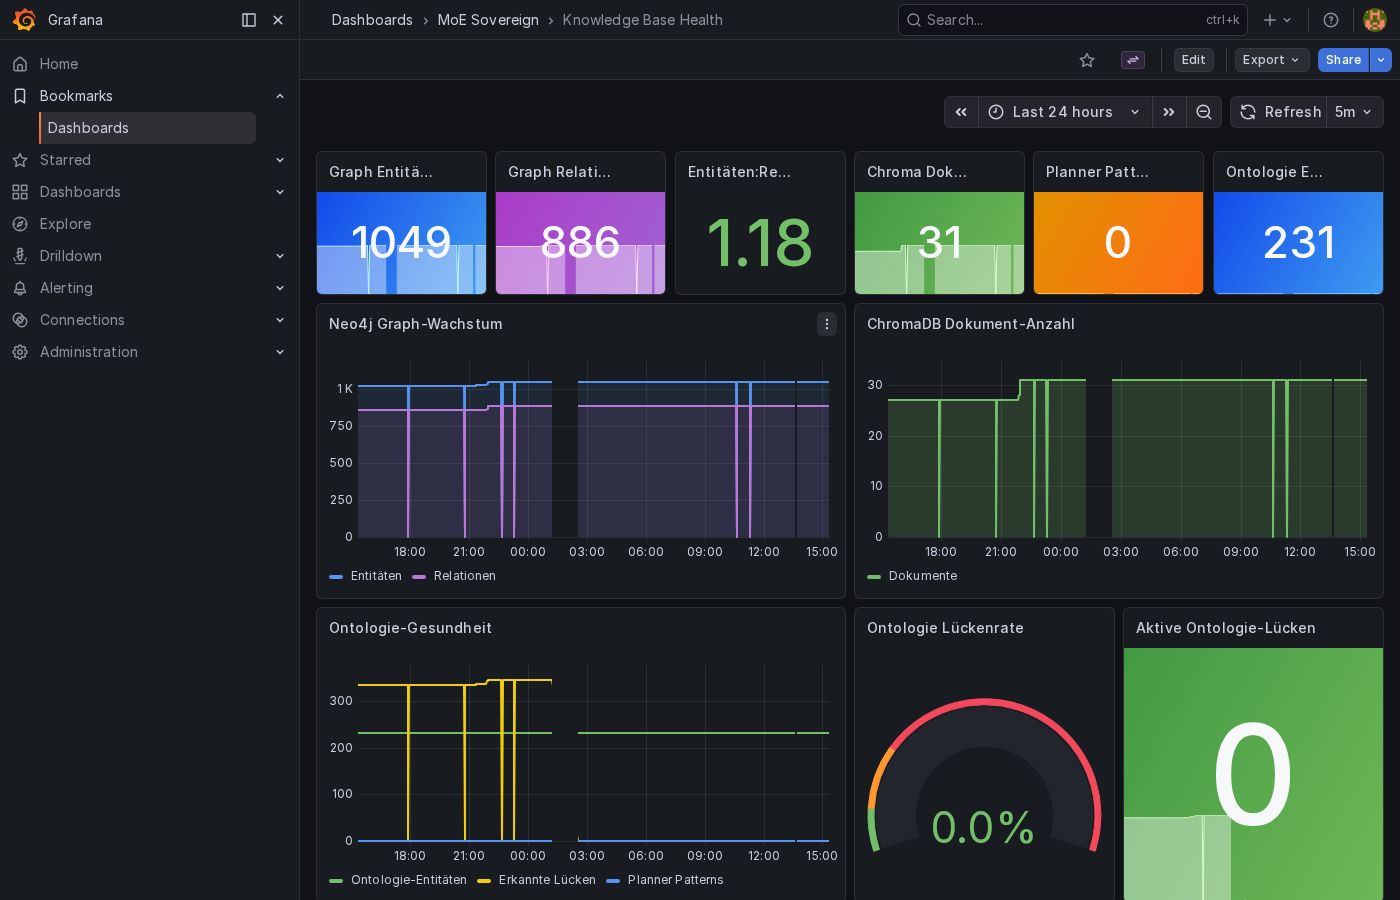
Knowledge Base Health
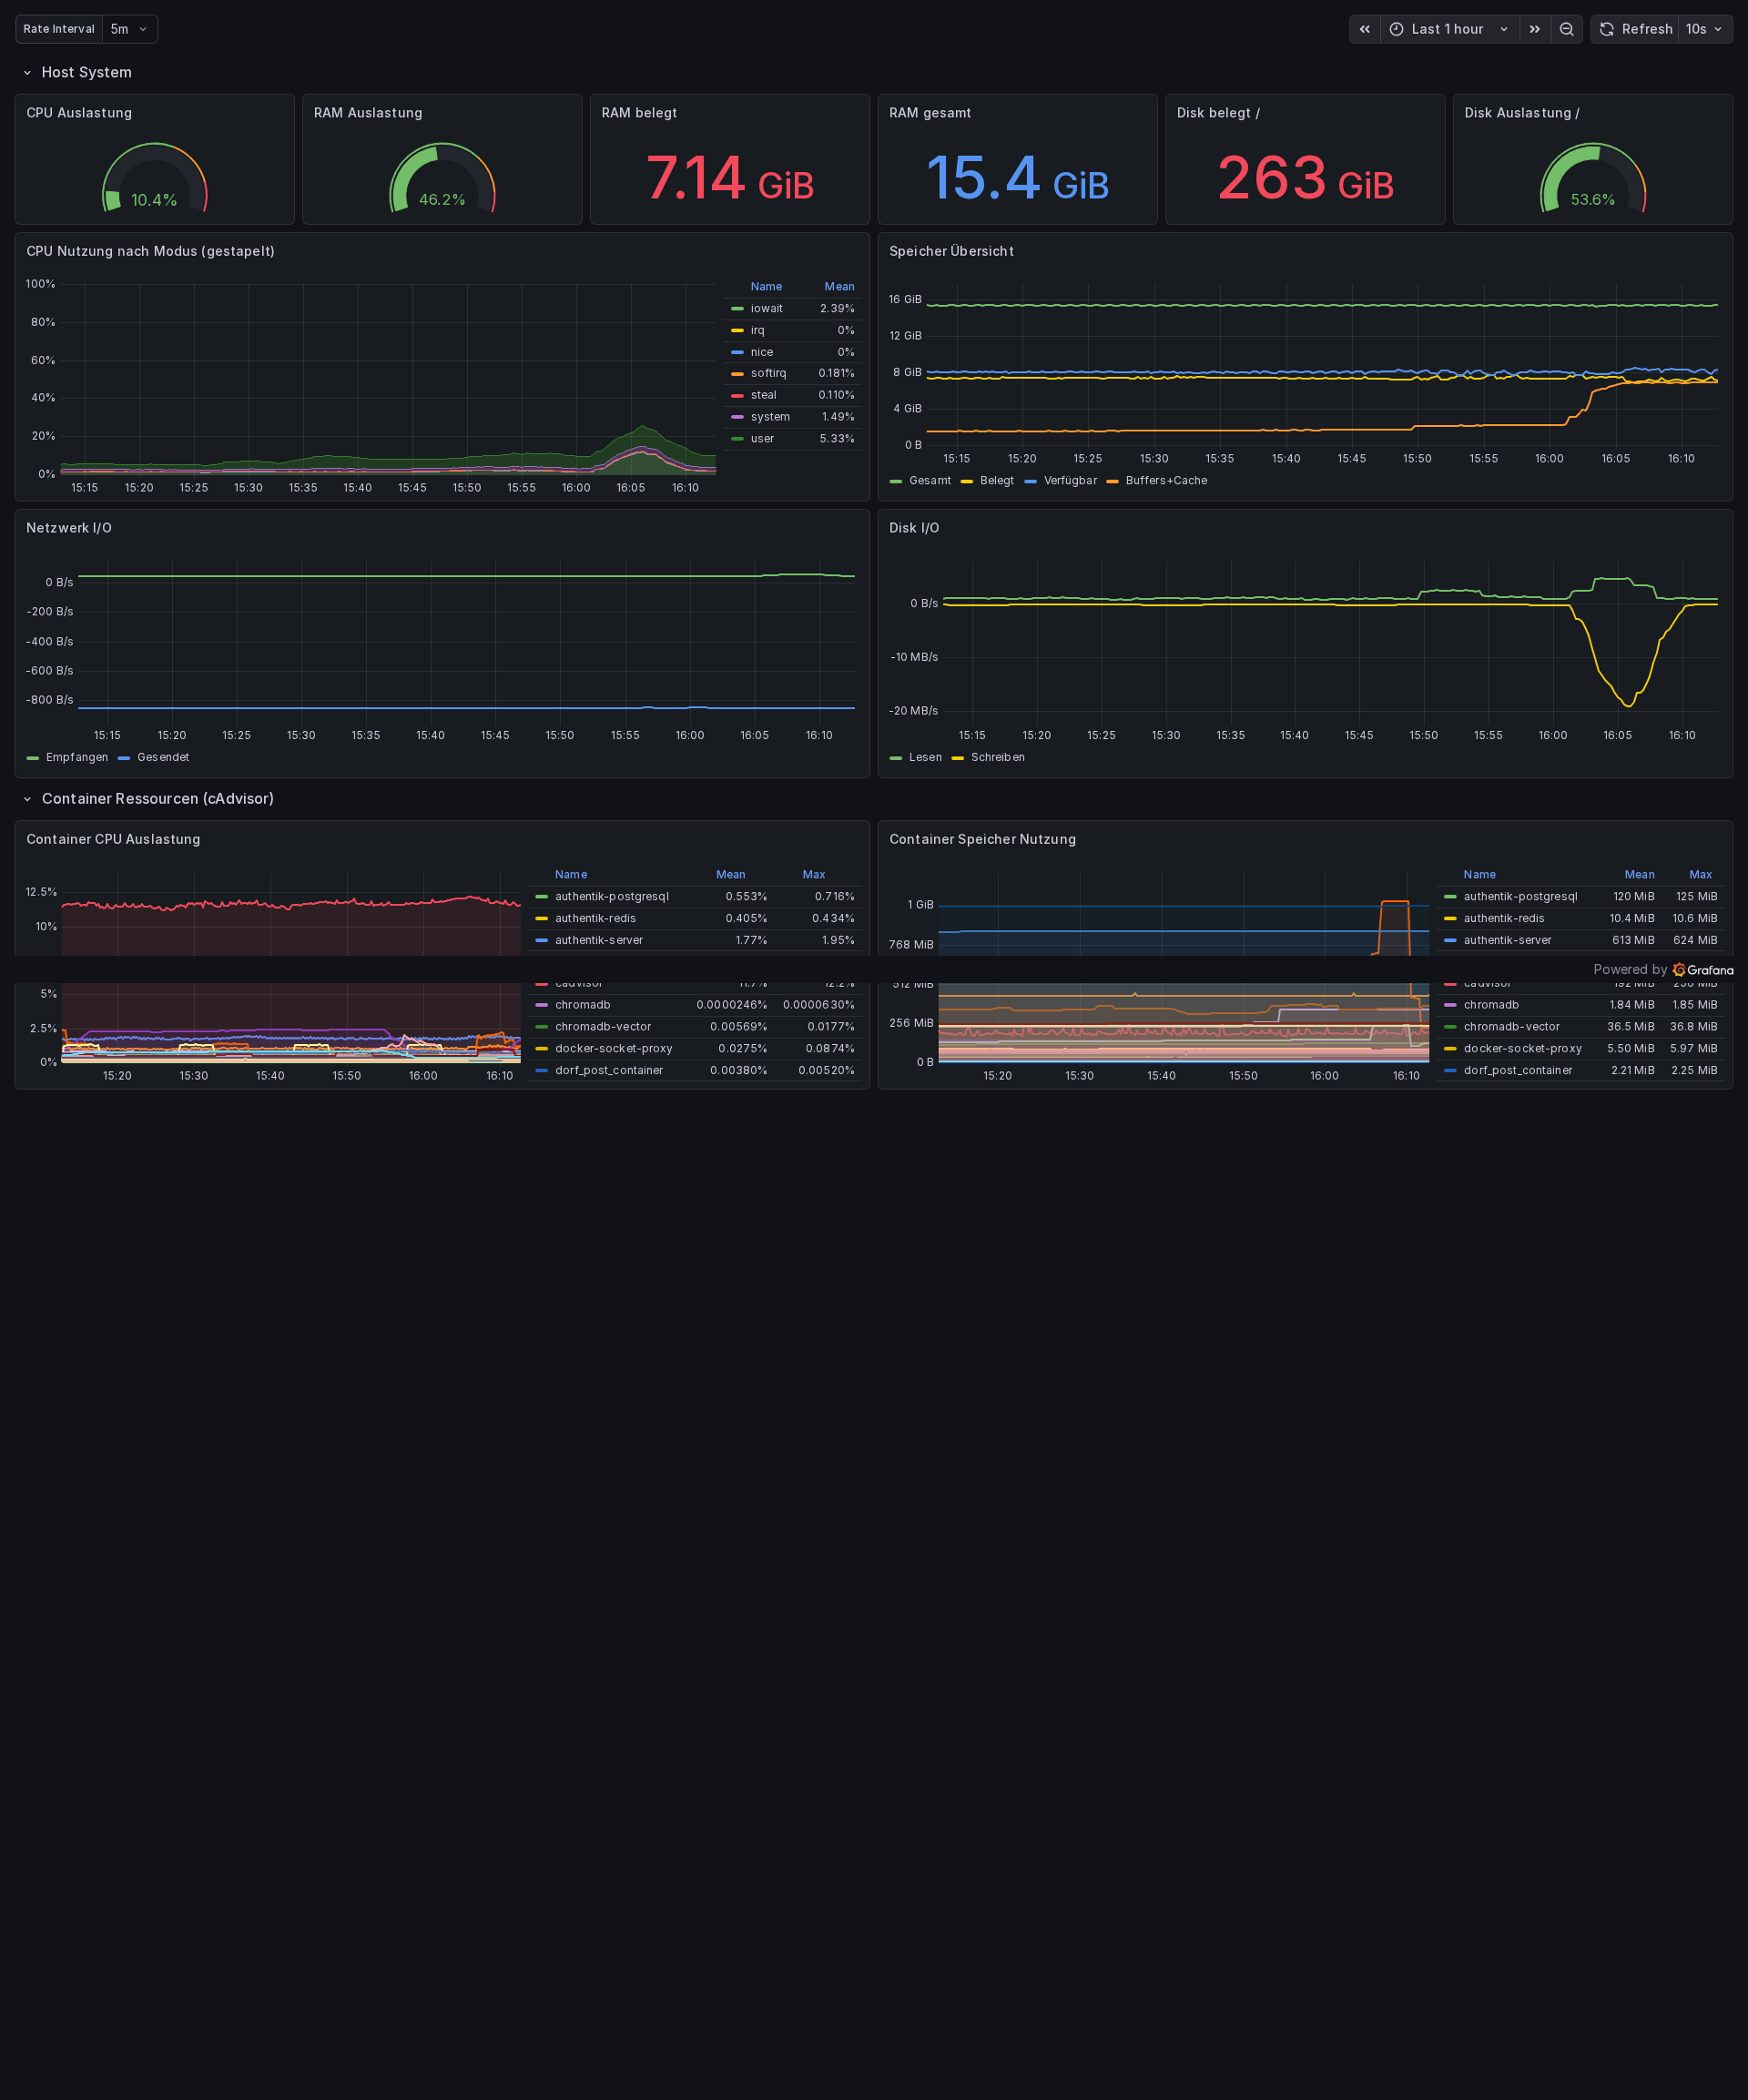
Infrastructure & Resources
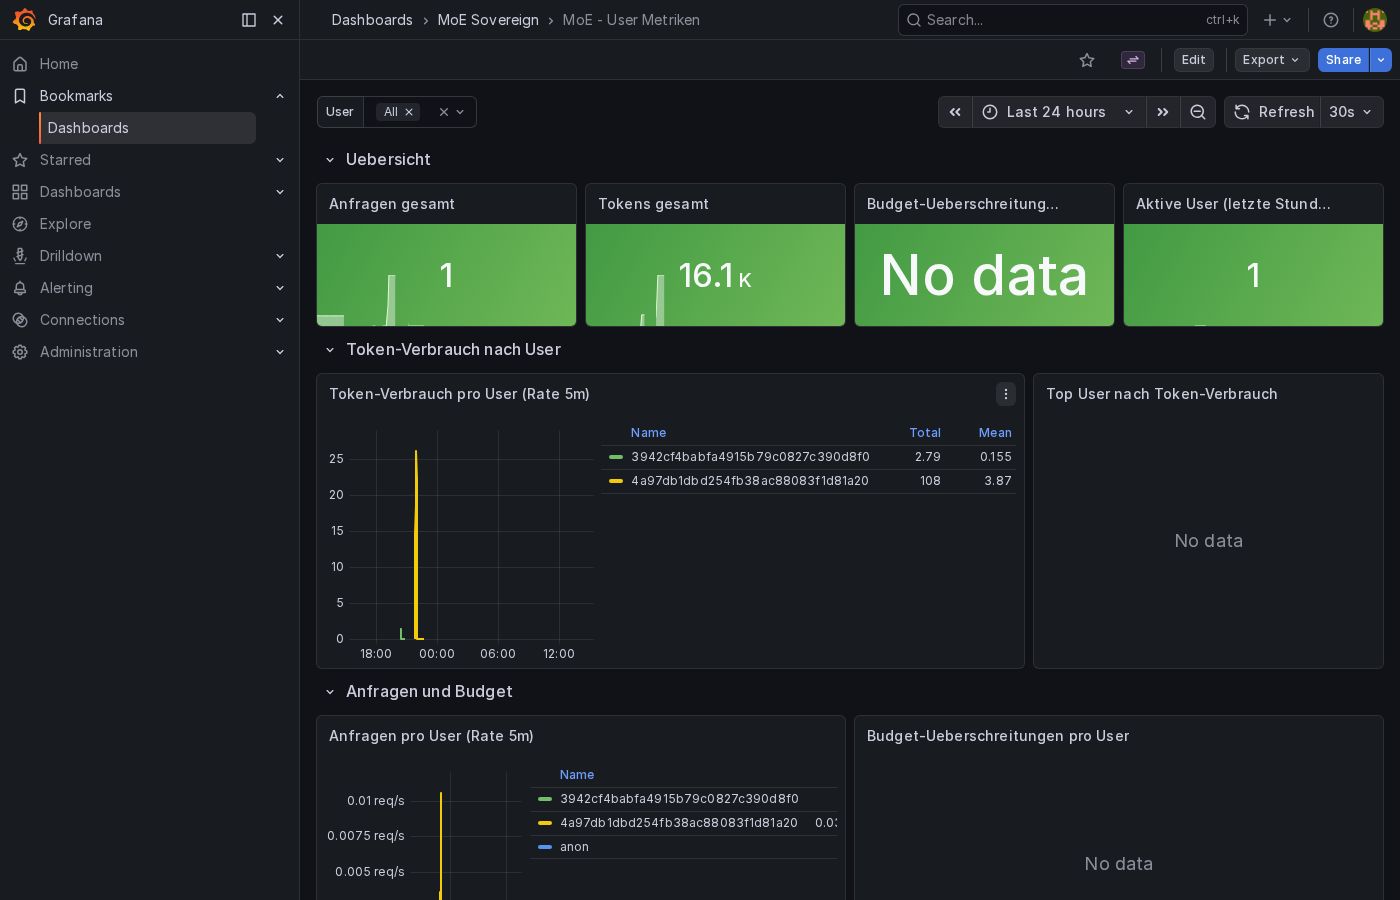
User Metrics
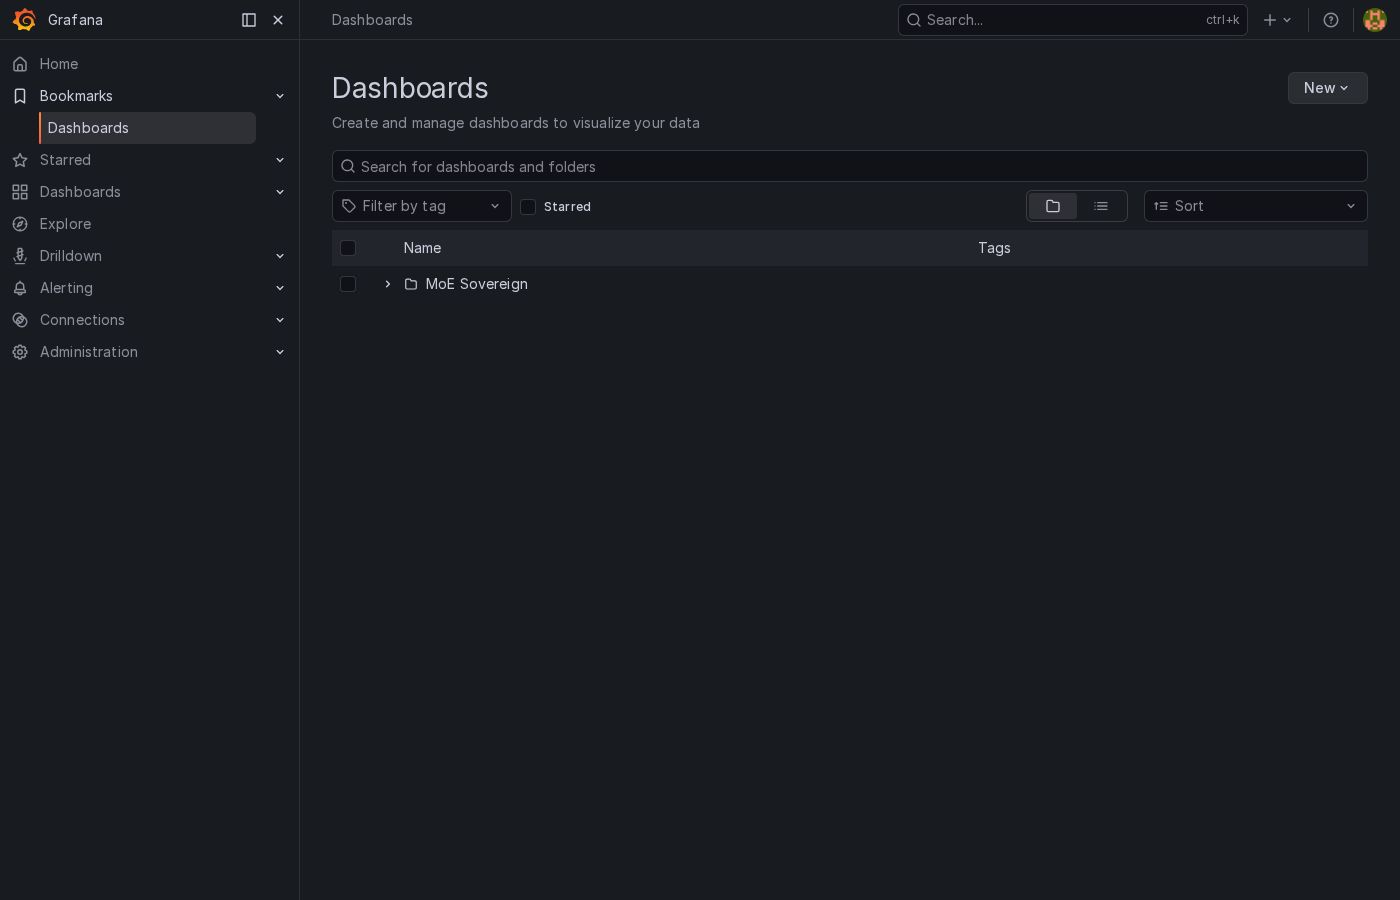
Dashboard List
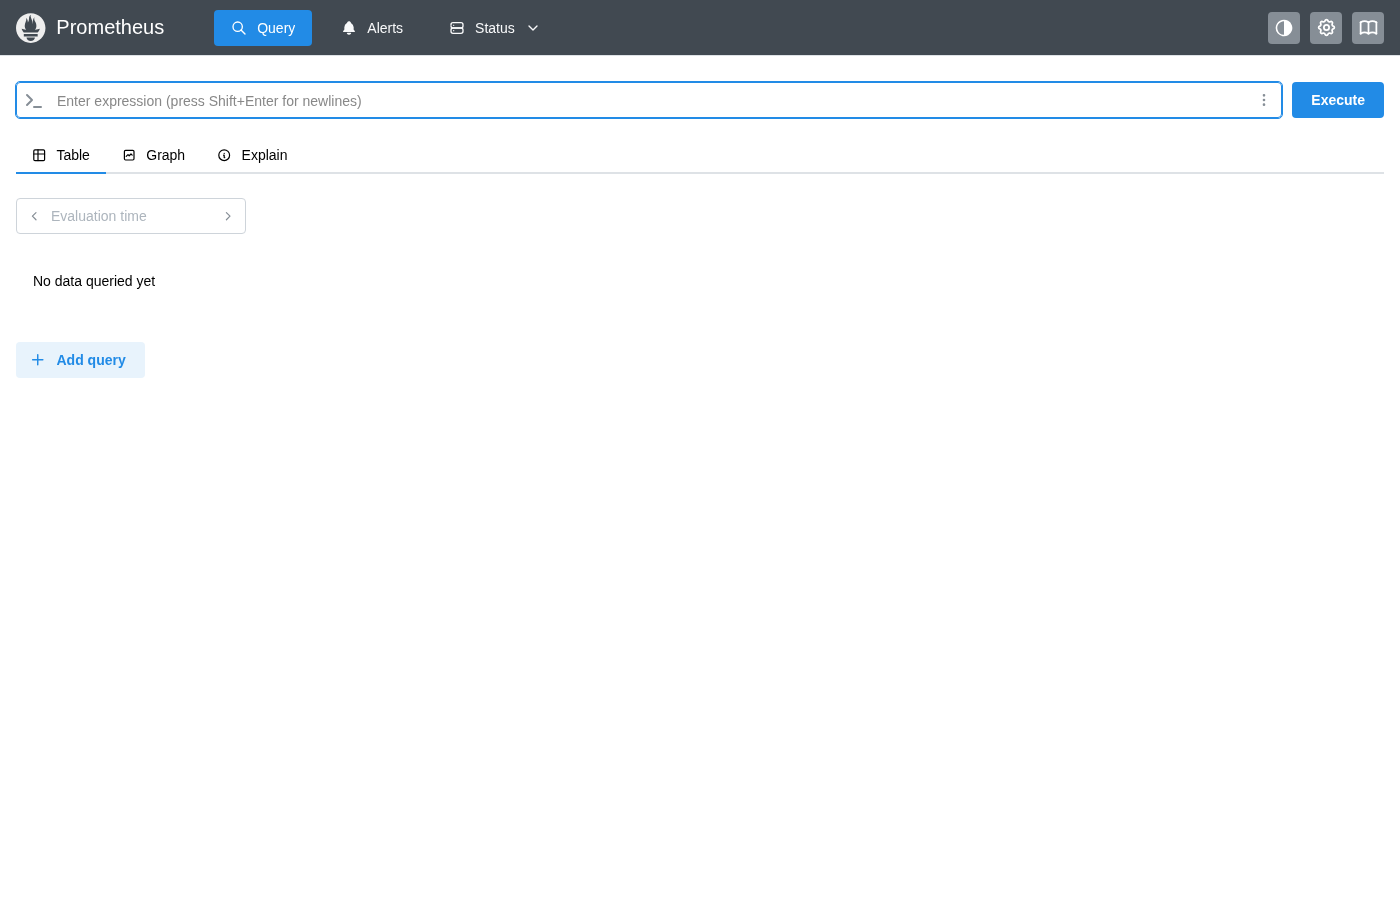
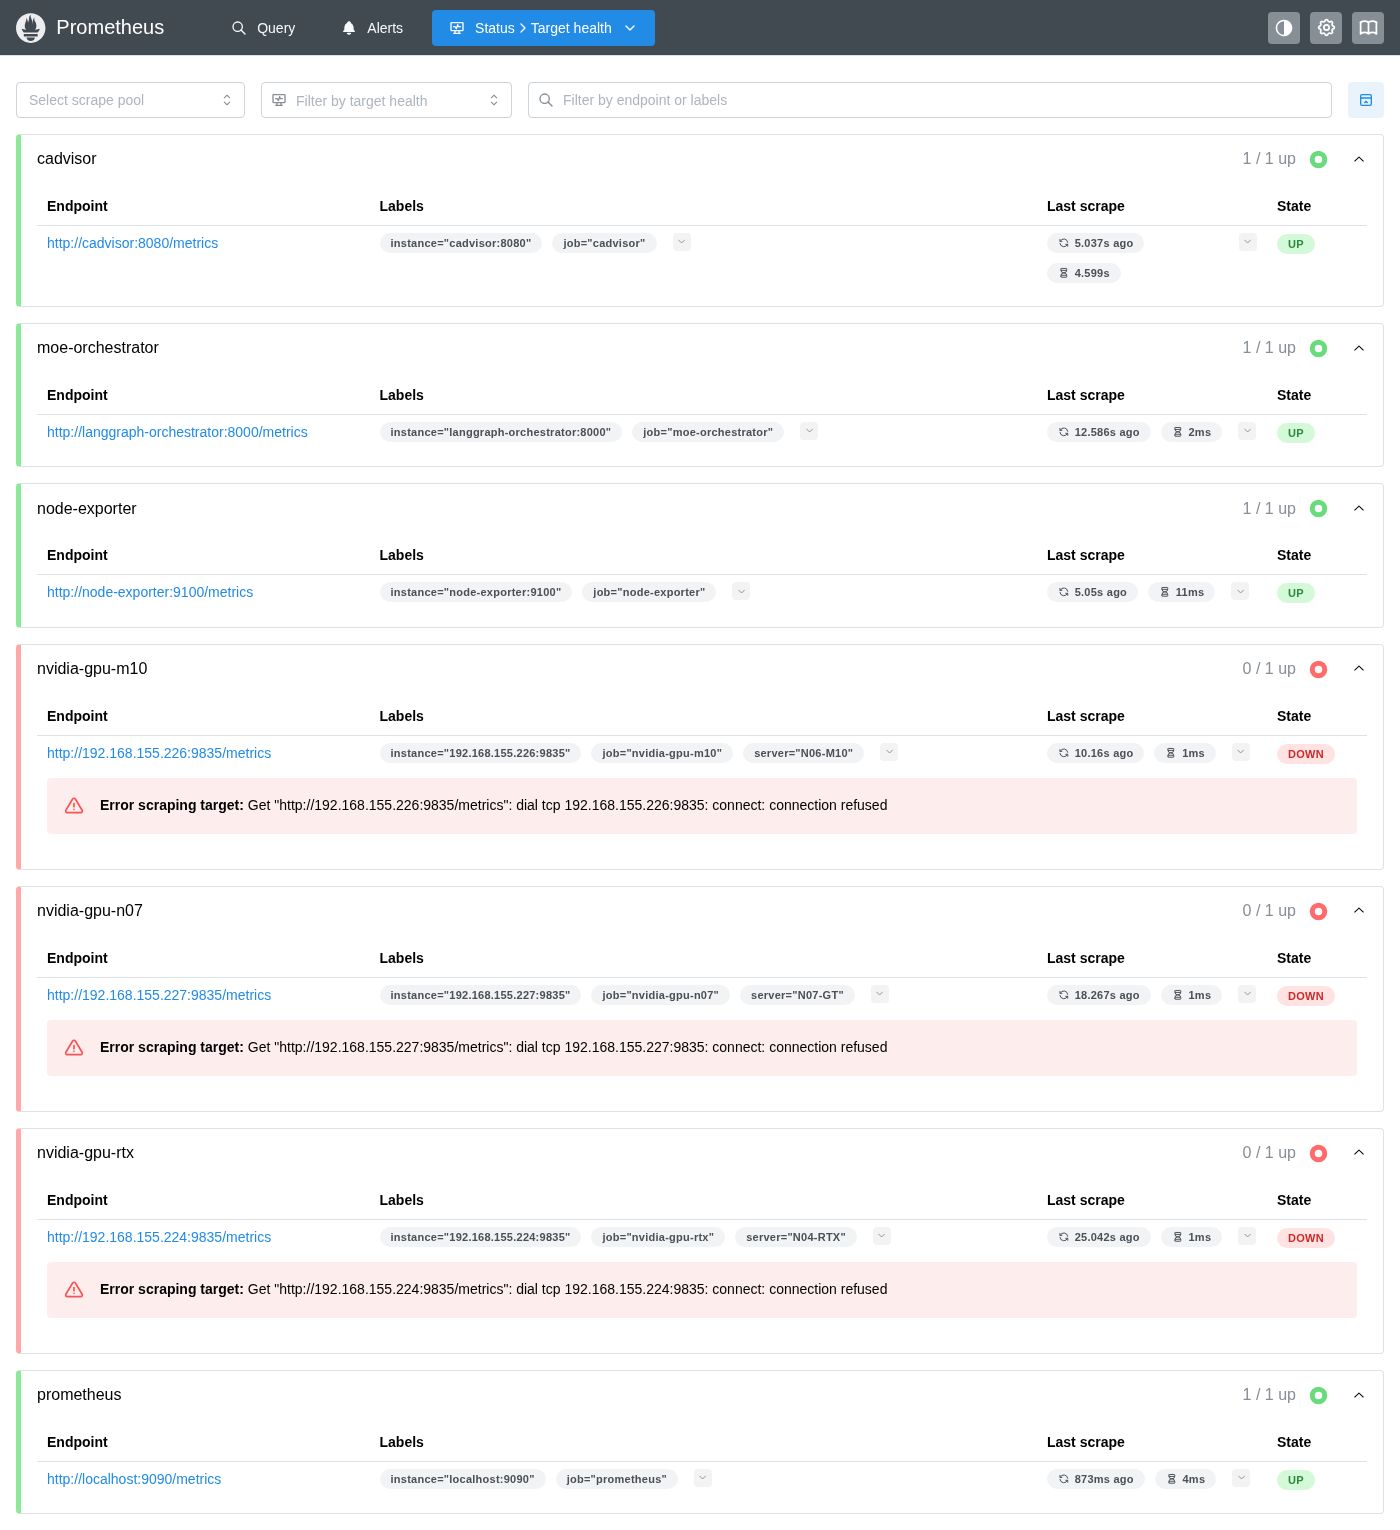
Prometheus
Query Interface
Scrape Targets
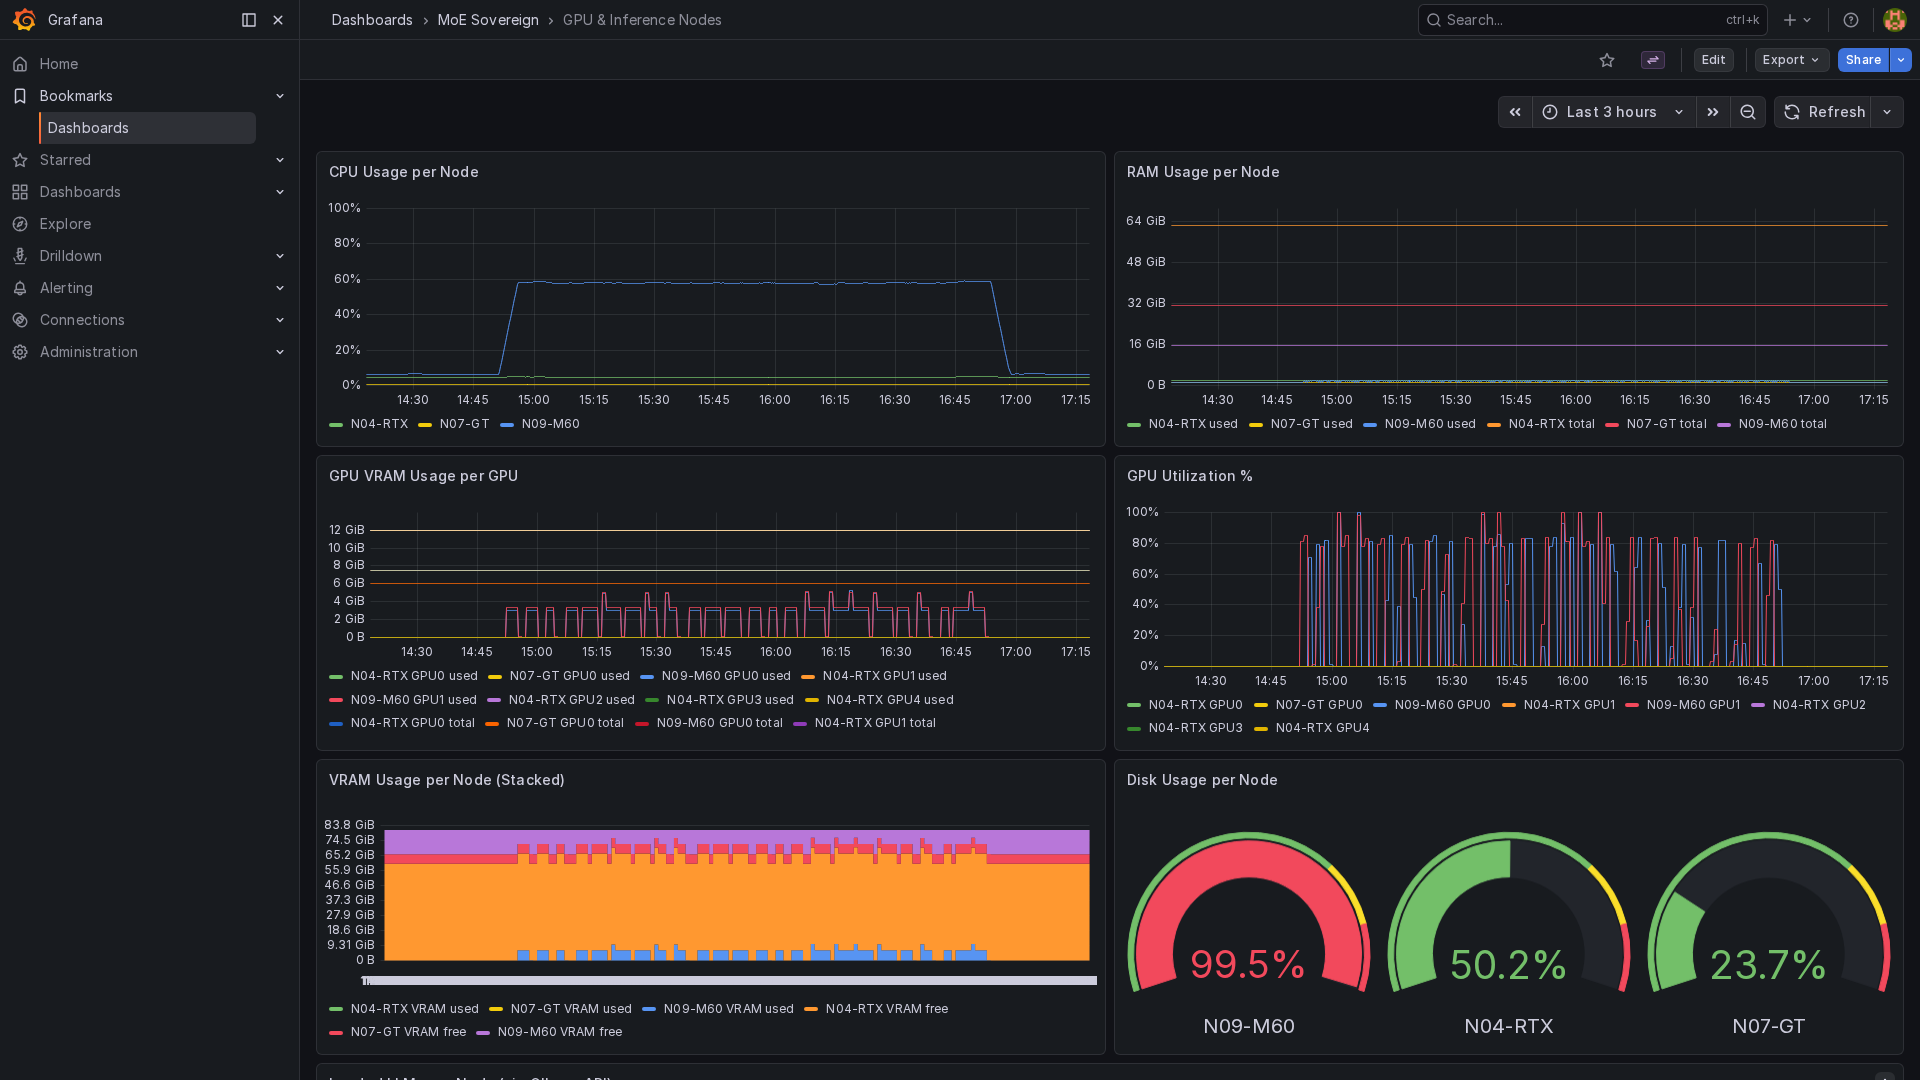
Grafana — GPU & Inference Nodes
Real-time GPU utilisation, VRAM occupancy, and per-model inference throughput across all heterogeneous nodes (RTX 4090, Tesla M60, Tesla M10, GT 1060). Captured in kiosk mode.
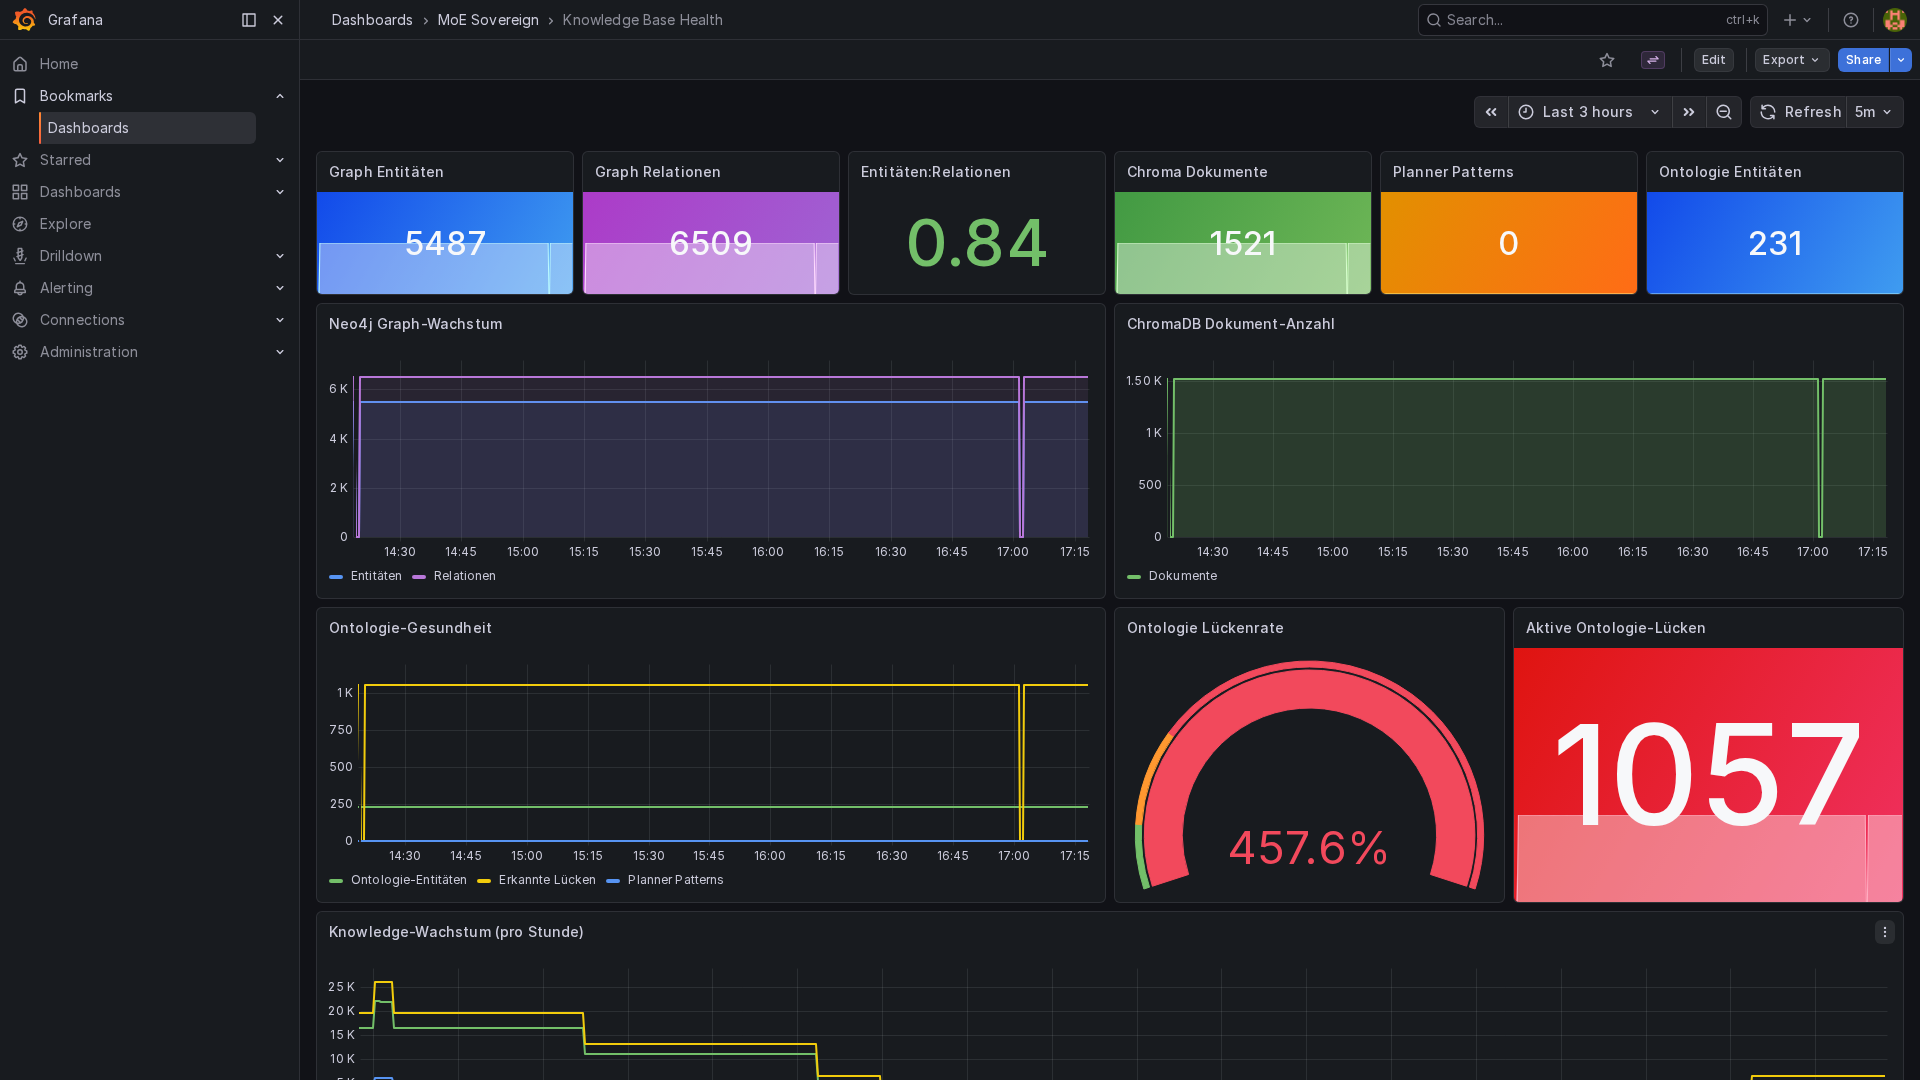
Grafana — Knowledge Base Health
Neo4j entity count, relation count, gap-queue depth (moe:ontology_gaps ZCARD),
and per-template healing throughput over the last 24 hours.
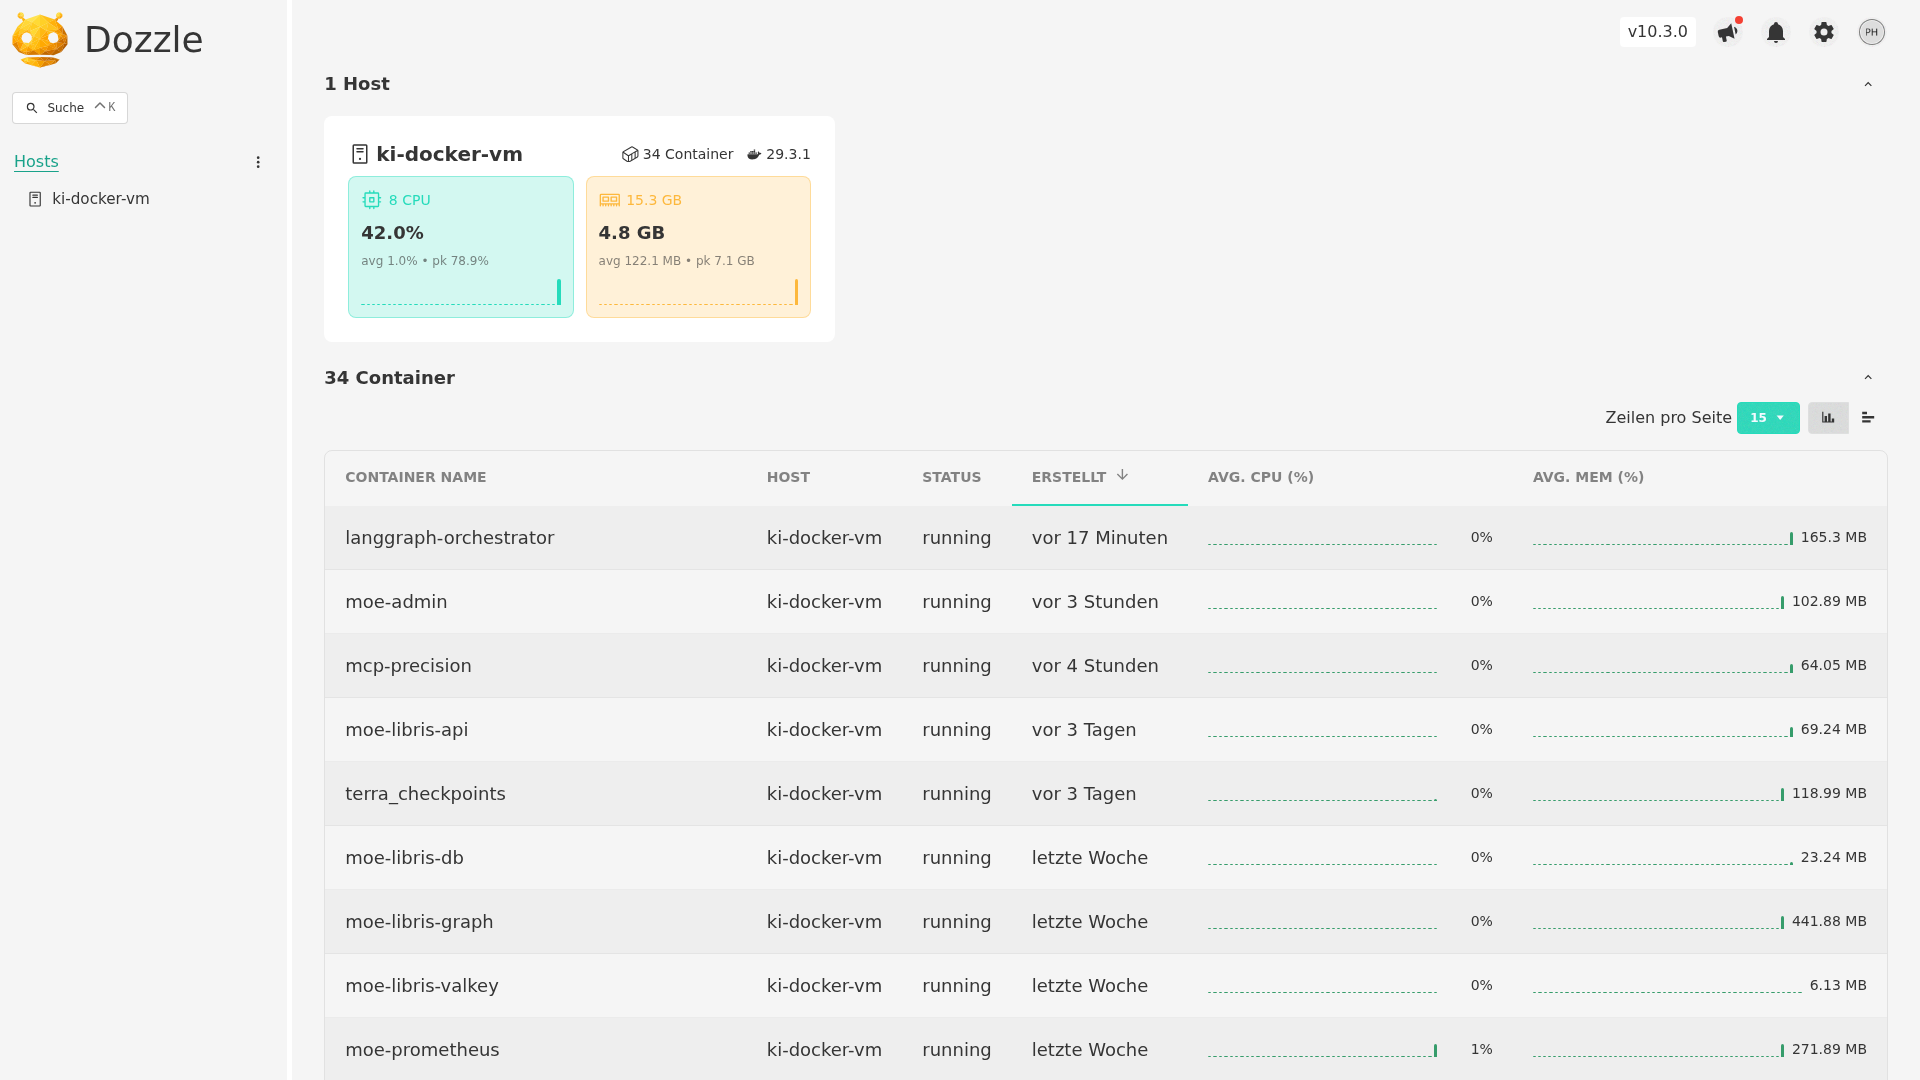
Dozzle — Log Viewer
Container log aggregation across all MoE Sovereign services, accessible without SSH access. Useful for real-time debugging during ontology gap healing runs.
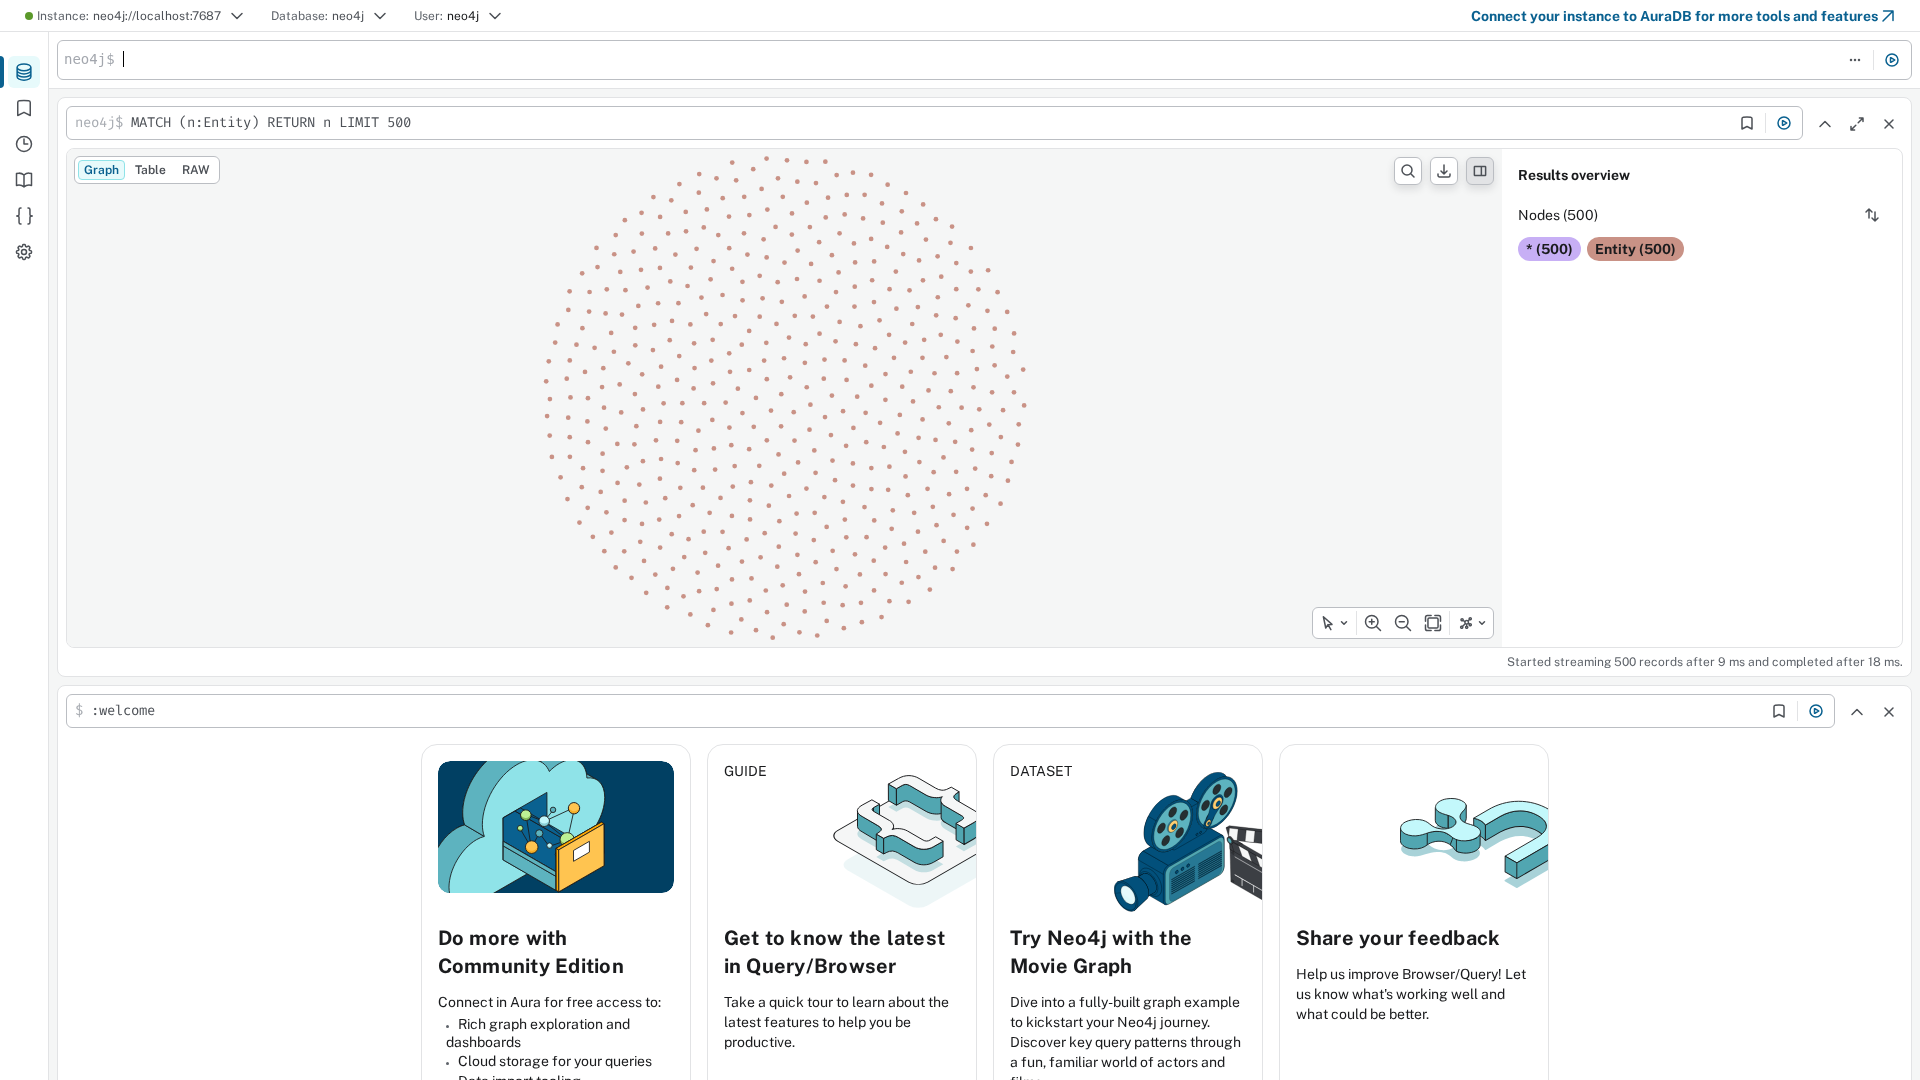
Neo4j — Knowledge Graph (500+ Entities)
Neo4j Browser showing a 500-entity subgraph excerpt: entities (Framework, Concept, Protocol, Tool) and their typed relations (IS_A, USES, IMPLEMENTS, PART_OF). The graph is the product of autonomous healing over multiple sessions.
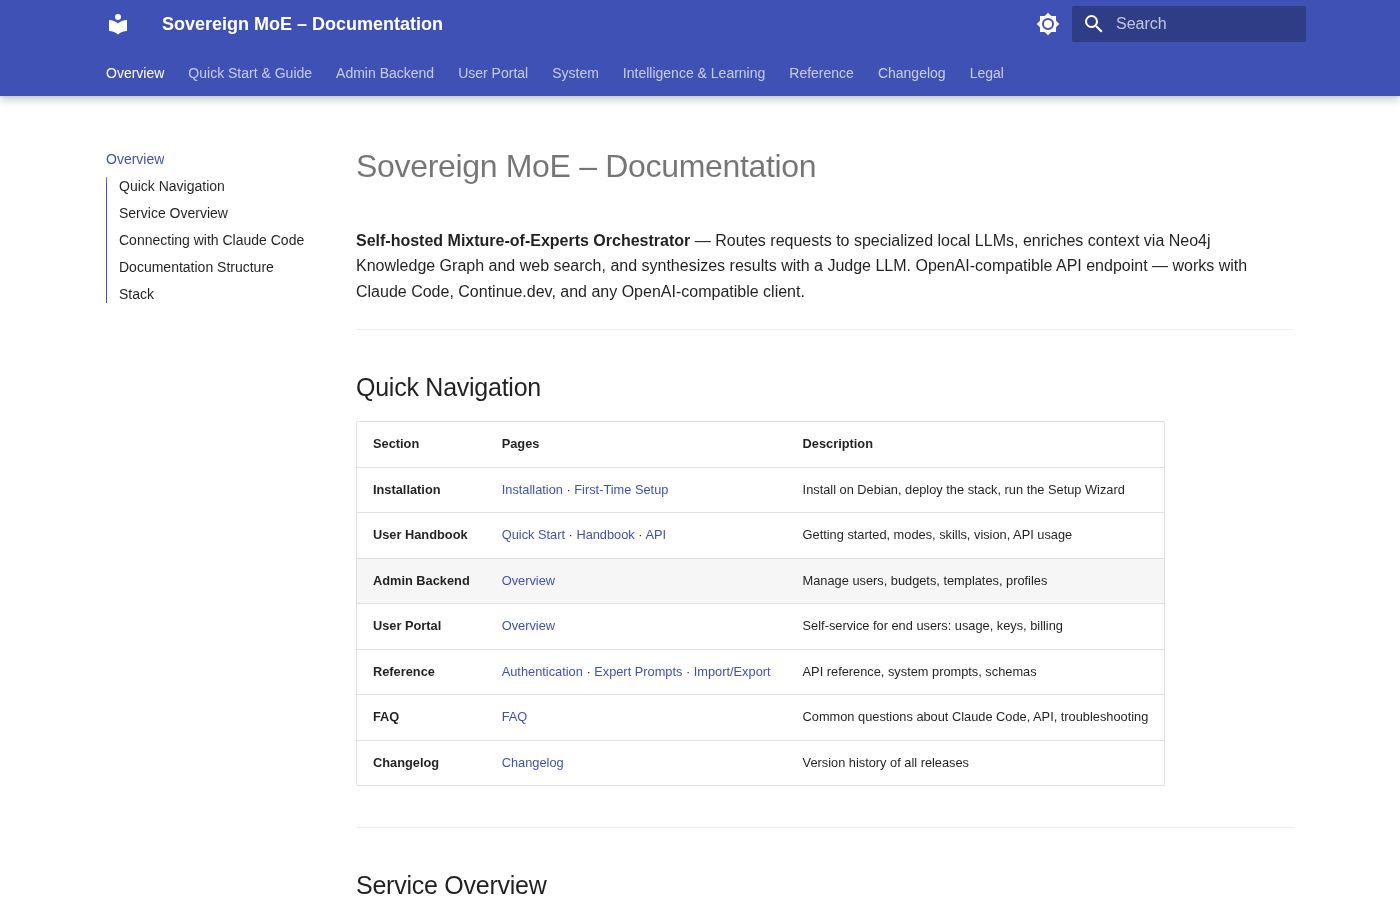
MkDocs Documentation
Home
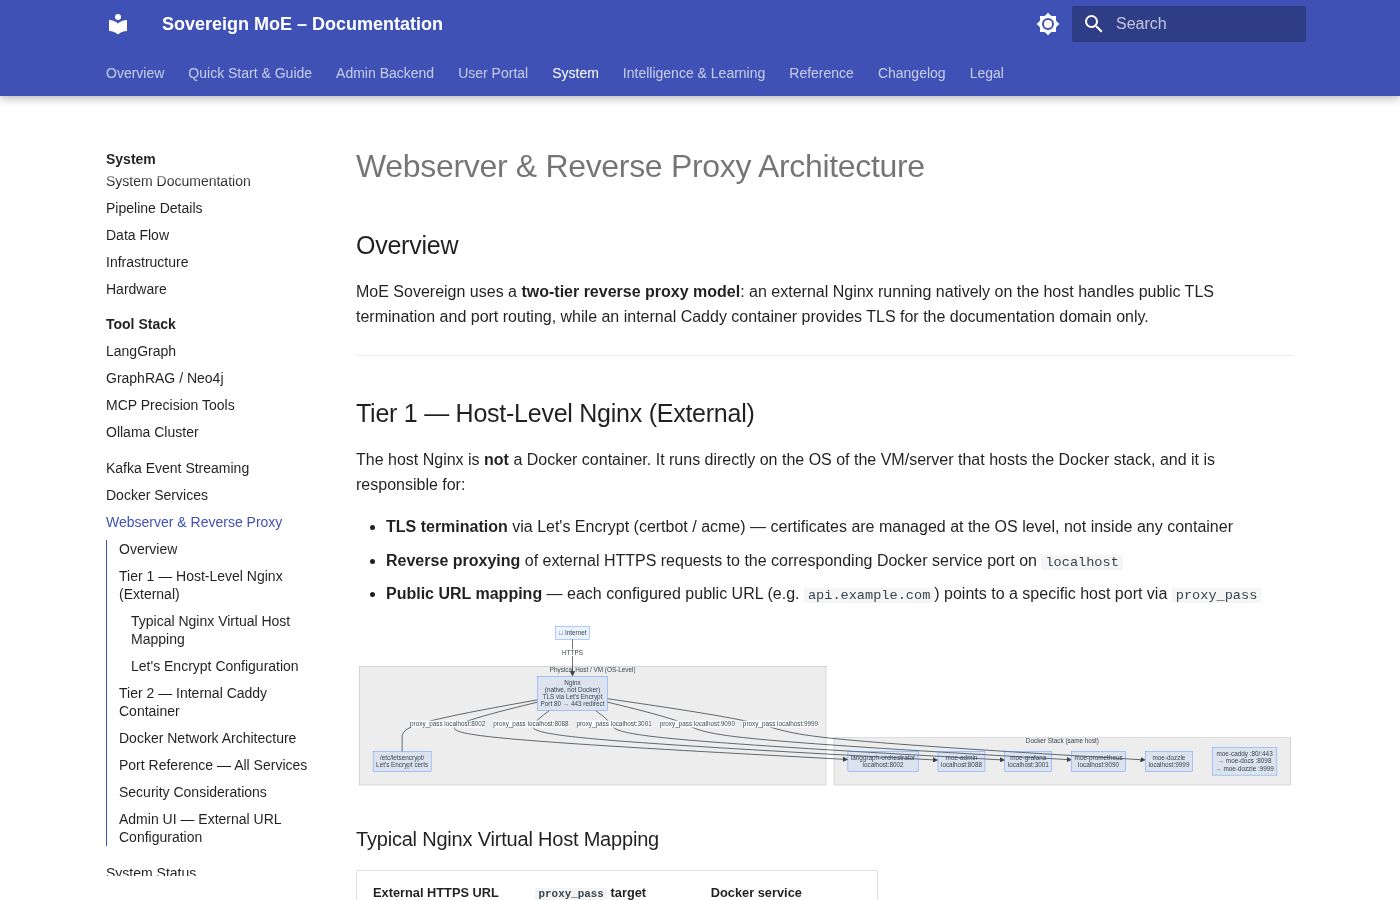
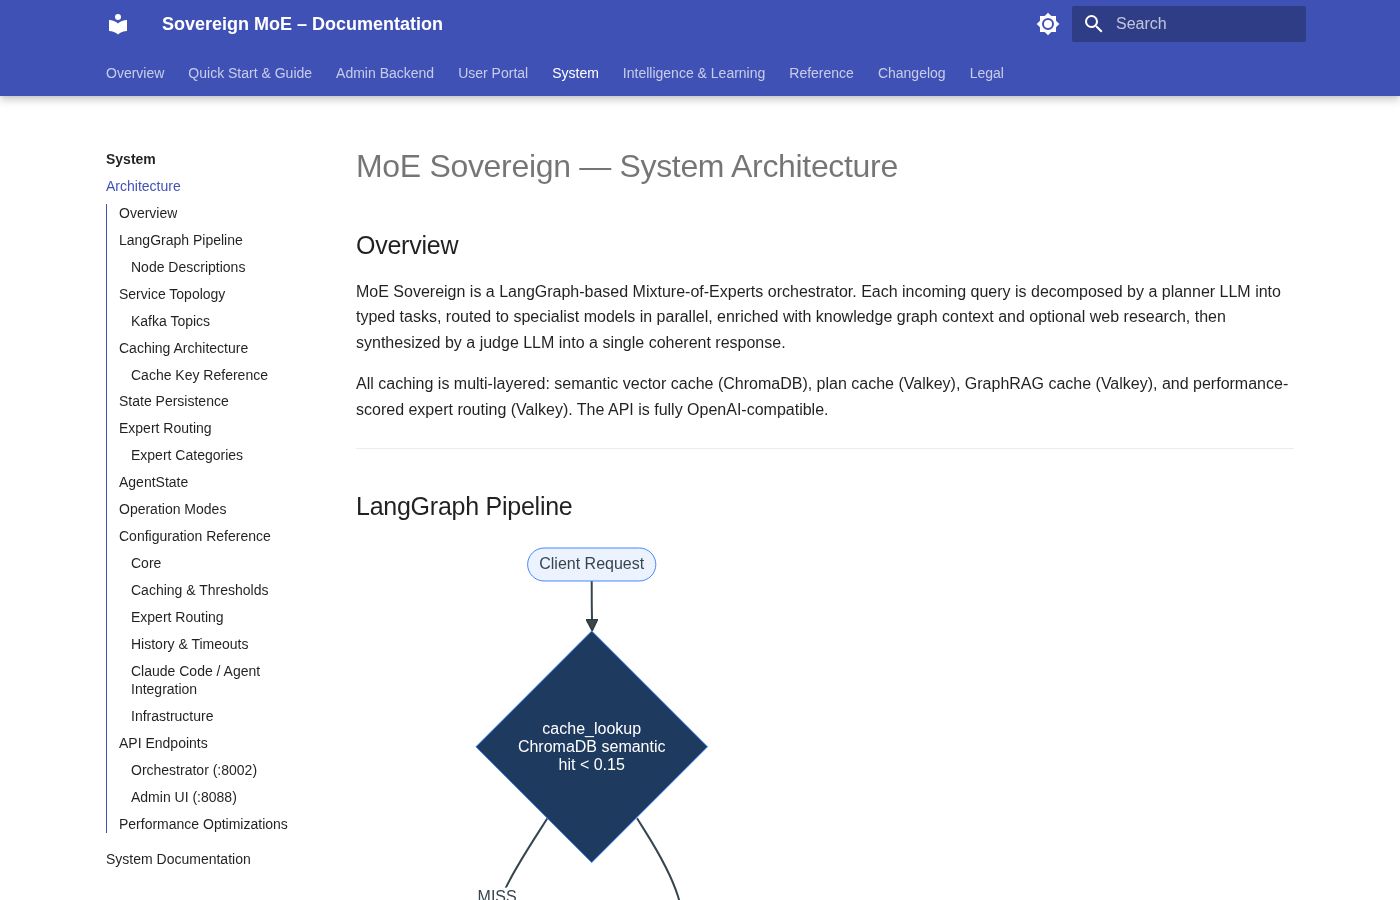
Architecture Page
Webserver & Reverse Proxy