Monitoring & Processes
The admin backend provides two monitoring layers: System Monitoring for aggregated Prometheus metrics and Live Monitoring for real-time process tracking with kill functionality.
Observability architecture at a glance
flowchart LR
    subgraph App["Orchestrator (main.py)"]
        M[prometheus_client<br/>/metrics endpoint]
        A[Valkey key<br/>moe:active:*]
        H[Valkey sorted-set<br/>moe:admin:completed]
    end
    subgraph Admin["Admin UI"]
        SM["/monitoring<br/>(Chart.js + PromQL)"]
        LM["/live-monitoring<br/>(polling 5 s)"]
    end
    subgraph Ext["External"]
        P[(Prometheus)]
        G[(Grafana)]
    end

    M -- scrape 15 s --> P
    P -- PromQL --> SM
    P -- datasource --> G
    A -- Valkey SCAN --> LM
    H -- ZRANGE --> LM
    LM -- POST kill-request --> A

    classDef app fill:#eef2ff,stroke:#6366f1;
    classDef ui  fill:#f0fdf4,stroke:#16a34a;
    classDef ext fill:#fef3c7,stroke:#d97706;
    class M,A,H app;
    class SM,LM ui;
class P,G ext;- System Monitoring is pull-based: it queries Prometheus on-demand when the operator opens the page.
- Live Monitoring is poll-based: the browser hits Valkey-backed REST endpoints every 5 s.
- Both layers share the same
prometheus_clientdata surface but serve different latency needs.
Screenshots
System Monitoring
Fully populated dashboard after production traffic — all six system gauges, LLM server status row, Chart.js widgets for token usage, cache performance, expert-calls-by-category/model/mode, requests-by-mode donut, confidence distribution, and latency & ratings.
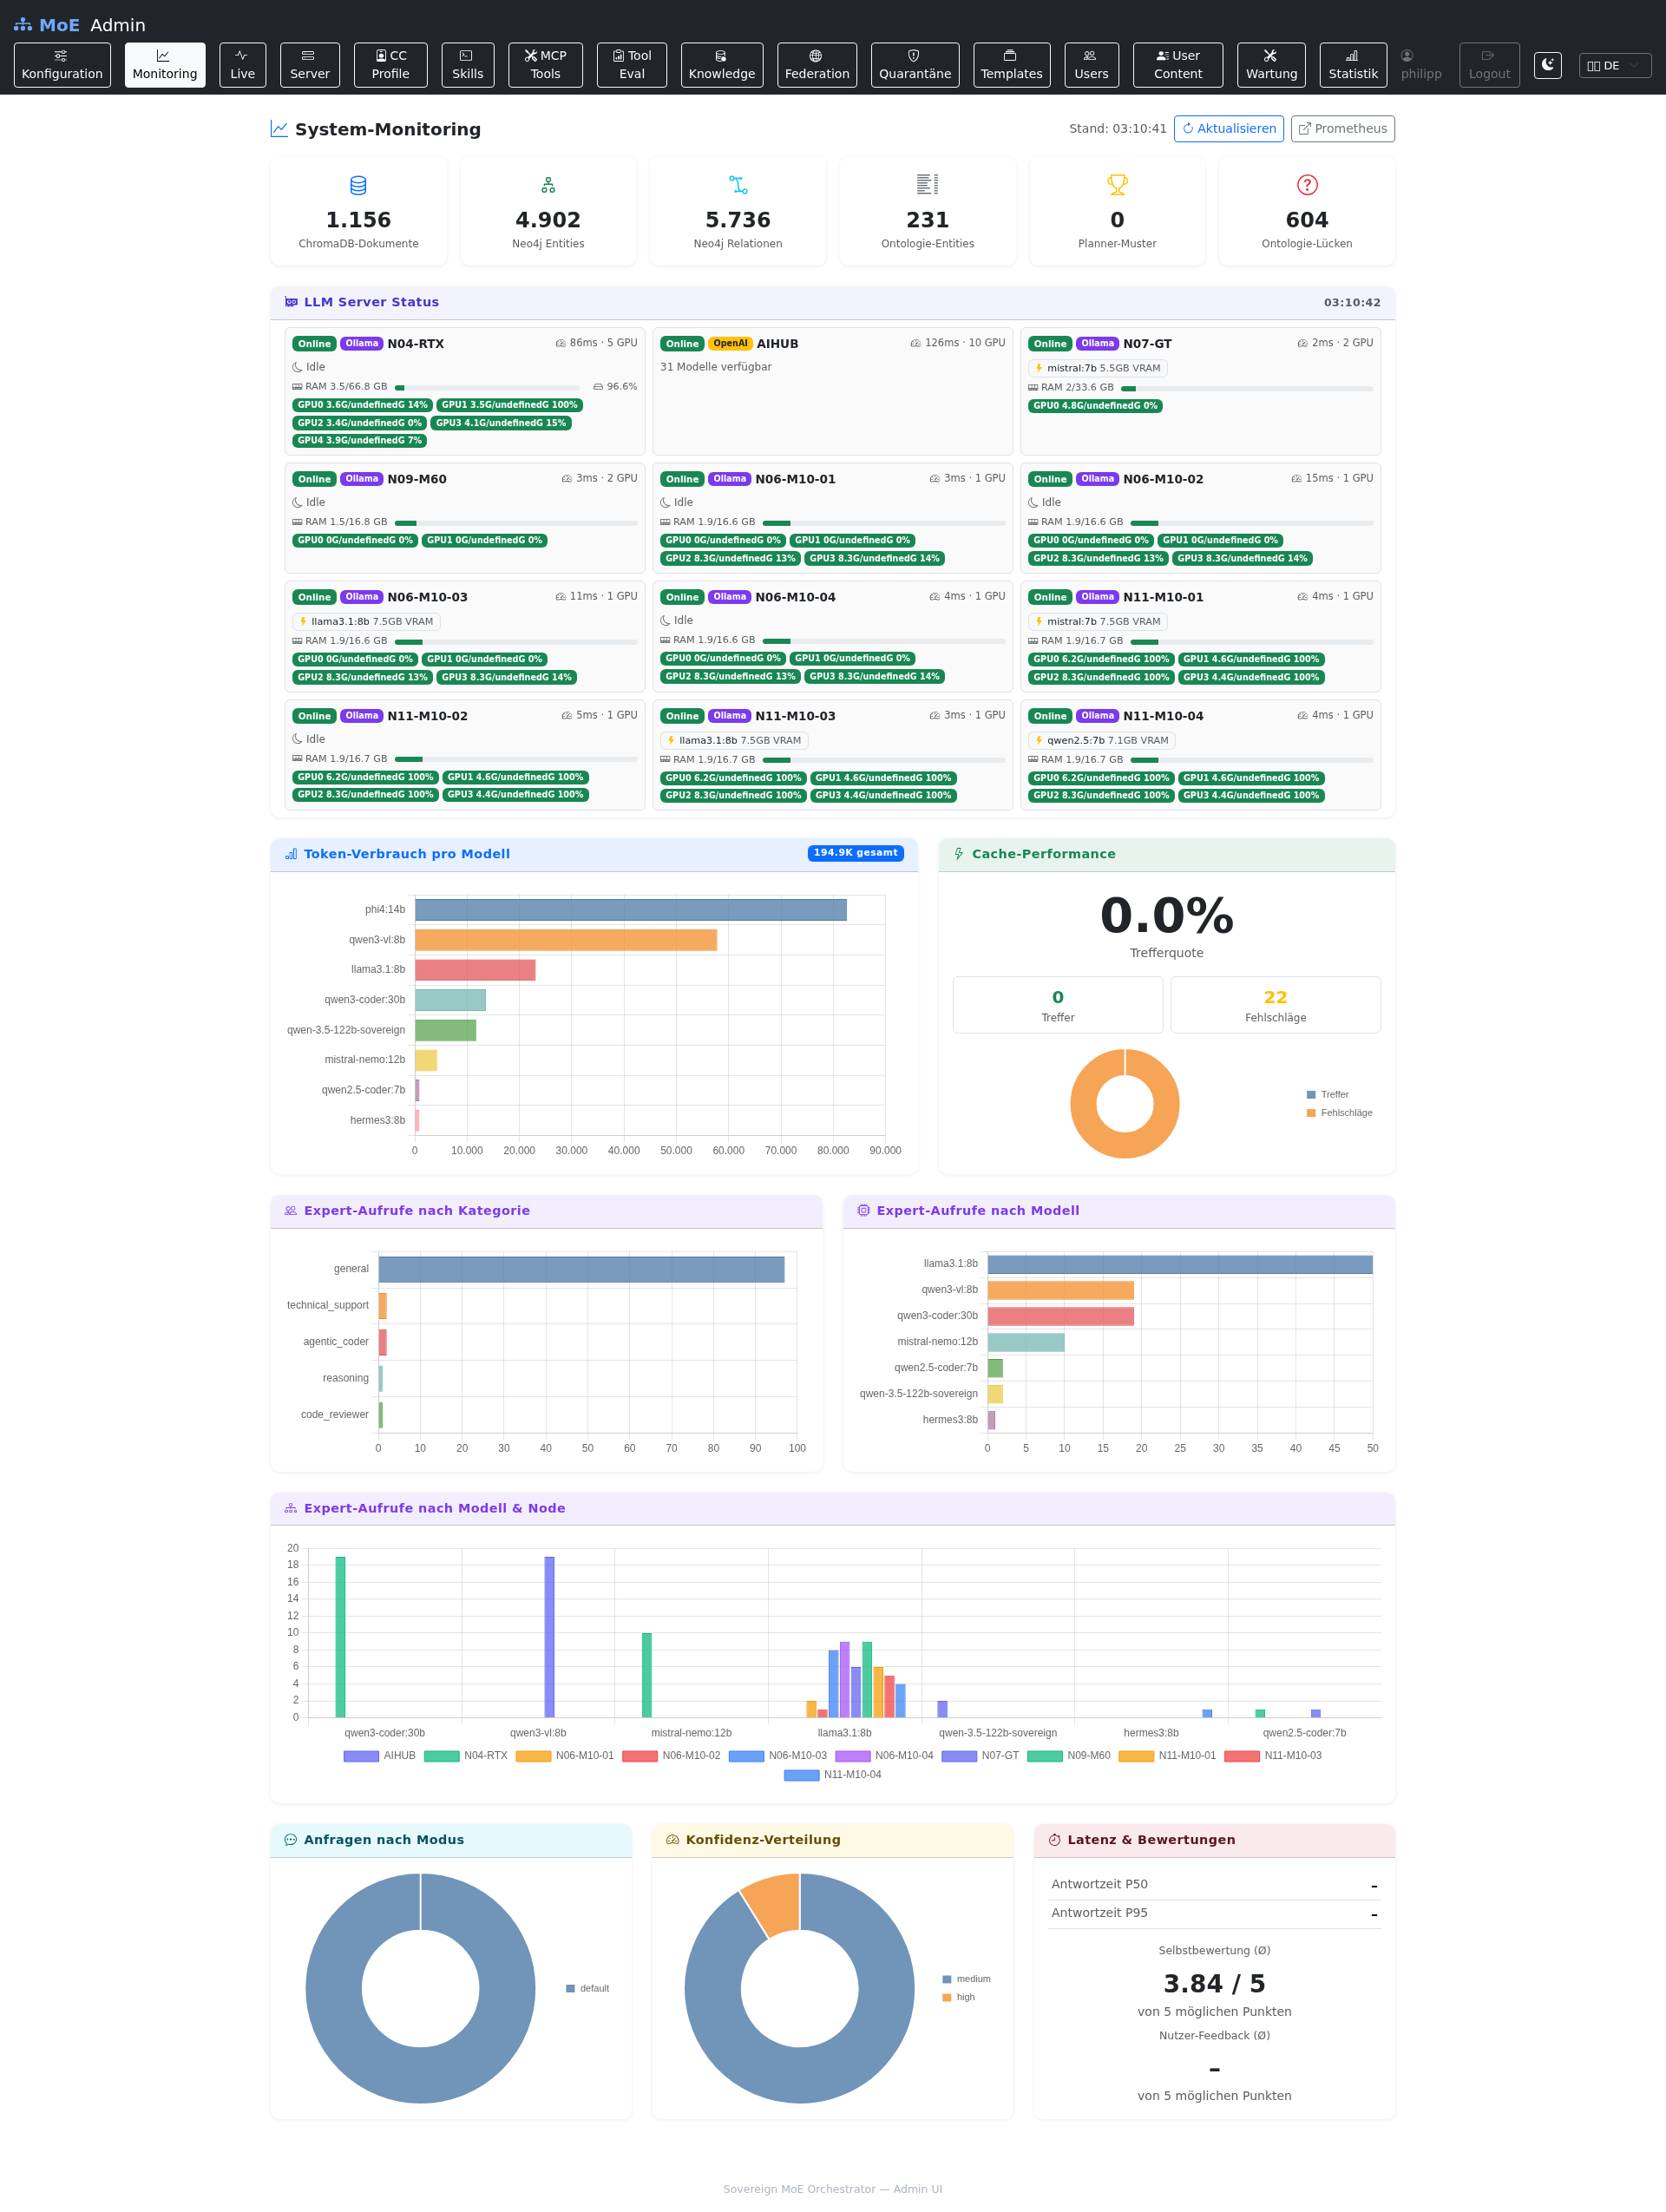
Privacy
Internal node identifiers in this screenshot (e.g. NODE-XX) are anonymised
placeholders. In a live deployment you will see your actual inference-server
names (as configured under Configuration → Servers).
Live Monitoring — Active Processes & History
Real-time view with a running long task (top panel, 6.2 min streaming request against an enterprise template) plus the recent history of completed requests.
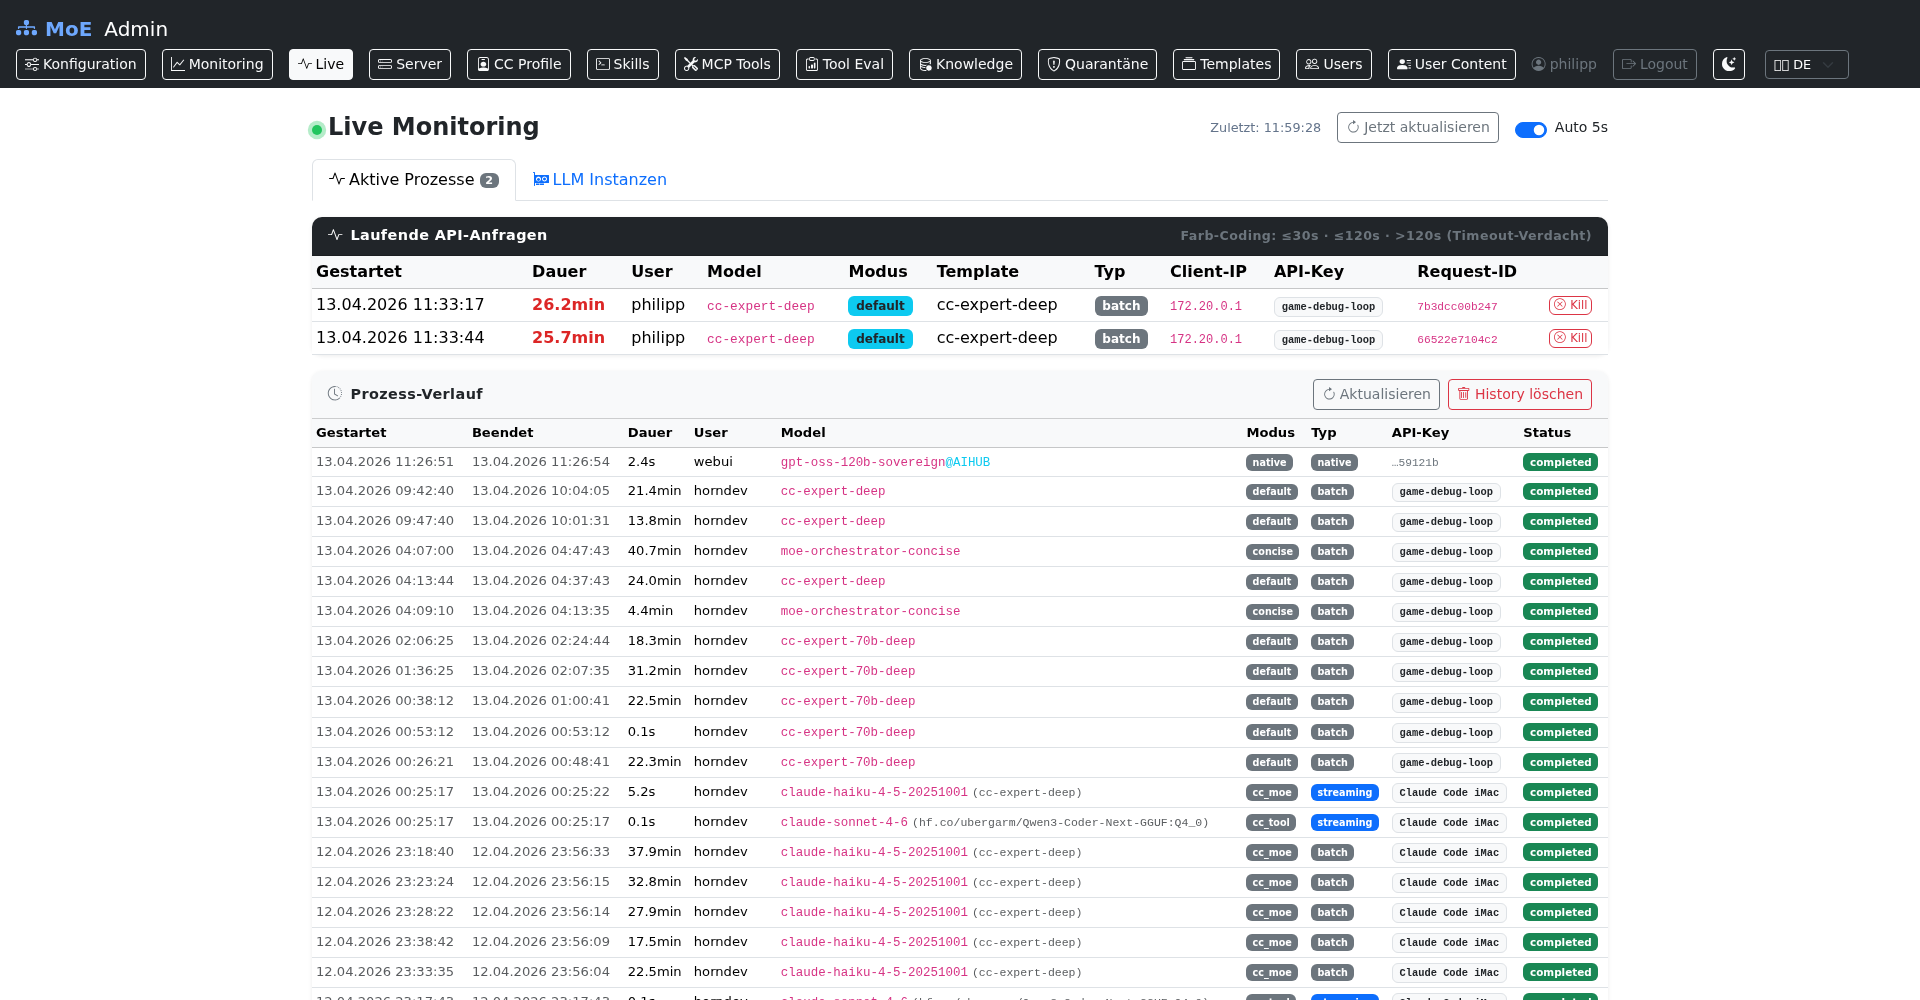
Redacted columns
For the docs, the User, Client IP, API-Key, Request ID, and Template columns are blurred. In your own install all columns are visible to admins — the mask is purely a documentation-time privacy filter.
Live Monitoring — LLM Instances tab
Per-server card view: loaded models with VRAM / parameters / quantisation / family / TTL, Ollama metrics (in-progress, queued, loaded, total requests, avg latency, I/O volumes), and an expandable list of all installed models per node.

Idle detection
Cards without any loaded models are labelled "Kein Modell geladen (idle)" — useful for spotting cold nodes during load-balancing reviews.
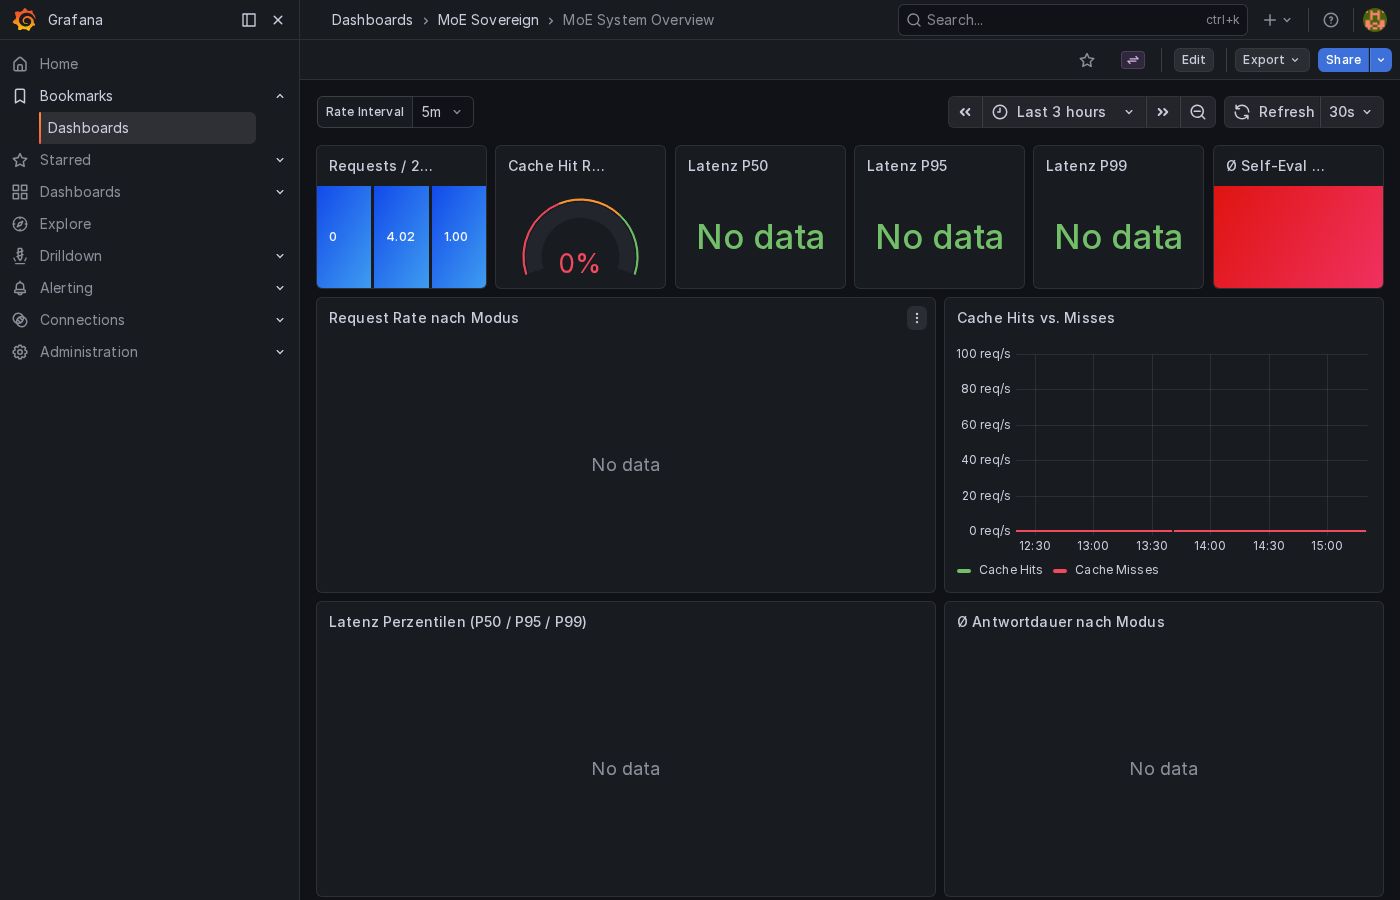
Grafana — MoE System Overview
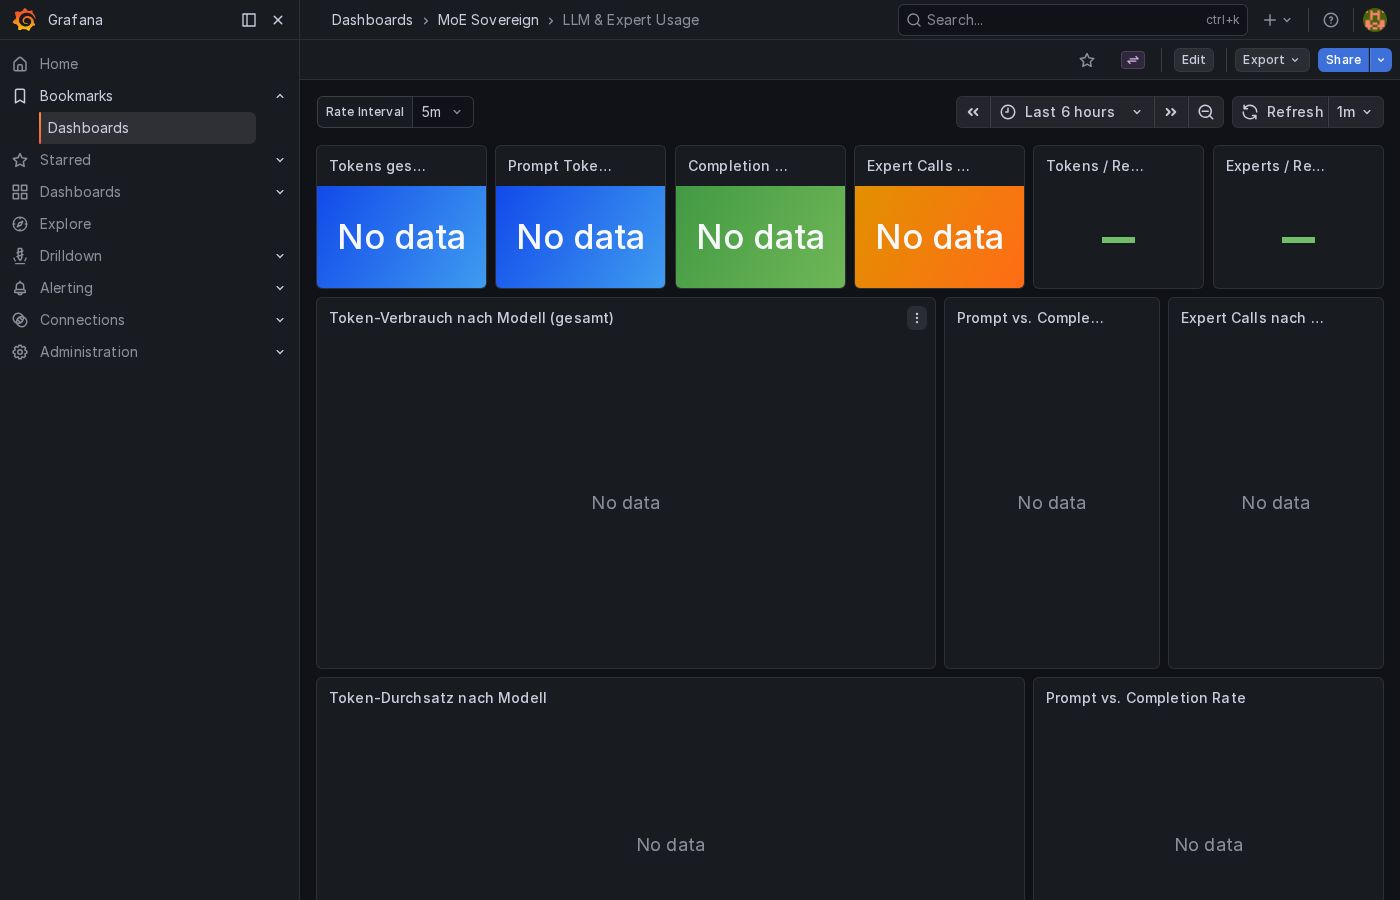
Grafana — LLM & Expert Usage
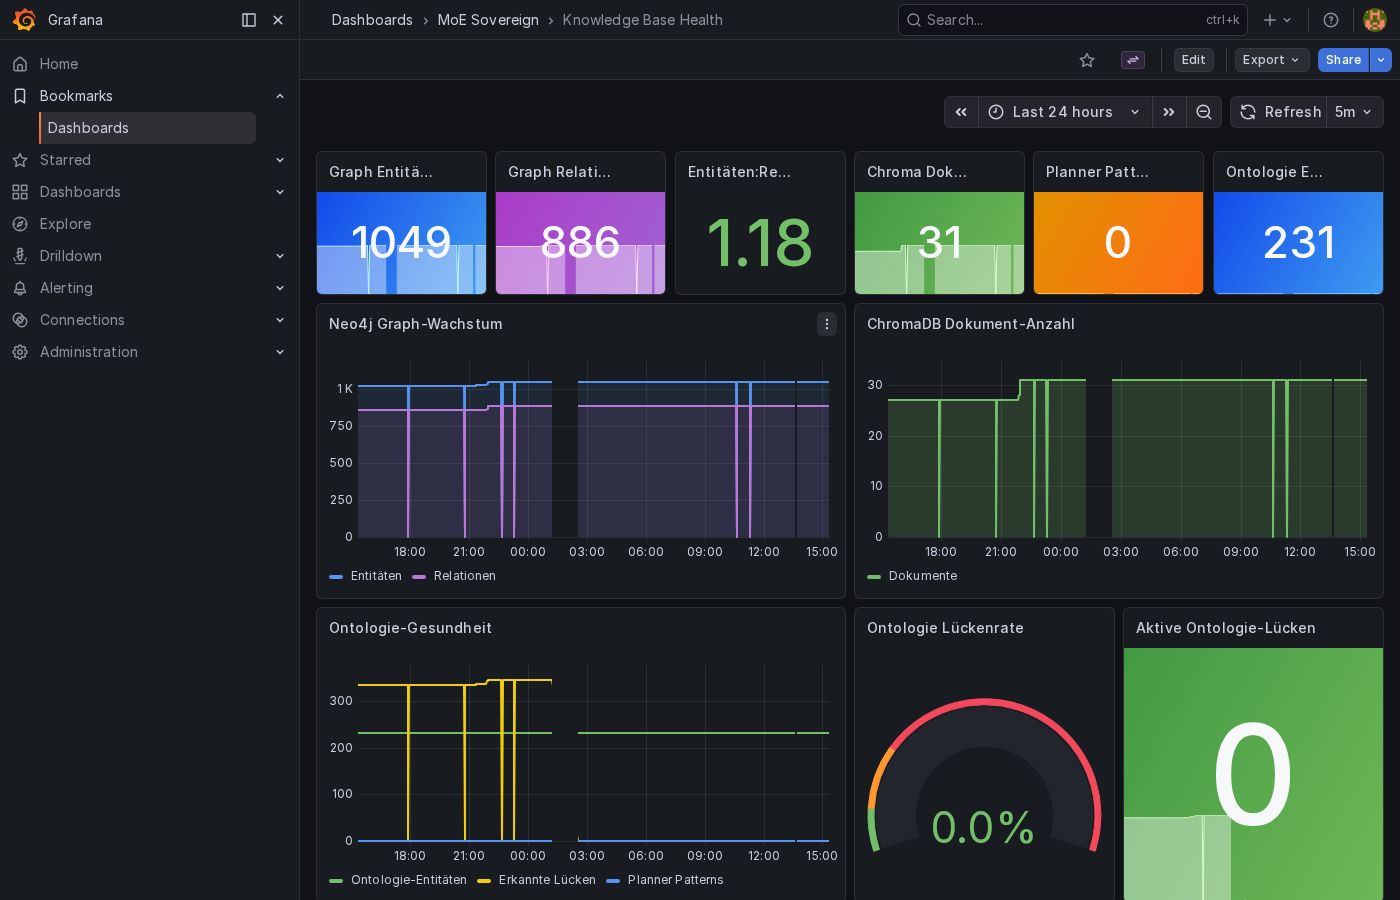
Grafana — Knowledge Base Health
Grafana — GPU & Inference Nodes
The moe-gpu-nodes dashboard (grafana/dashboards/moe-gpu-nodes.json) provides
per-node, per-GPU panels for VRAM usage, GPU utilization, RAM, and disk. Data
is scraped from node-exporter instances on each inference host via the
inference-nodes Prometheus job.
Key panels:
| Panel | Metric |
|---|---|
| VRAM Usage | node_gpu_memory_used_bytes / node_gpu_memory_total_bytes |
| GPU Utilization | node_gpu_utilization_percent |
| RAM Usage | node_memory_MemTotal_bytes - node_memory_MemAvailable_bytes |
| Disk Usage | node_filesystem_size_bytes - node_filesystem_avail_bytes |
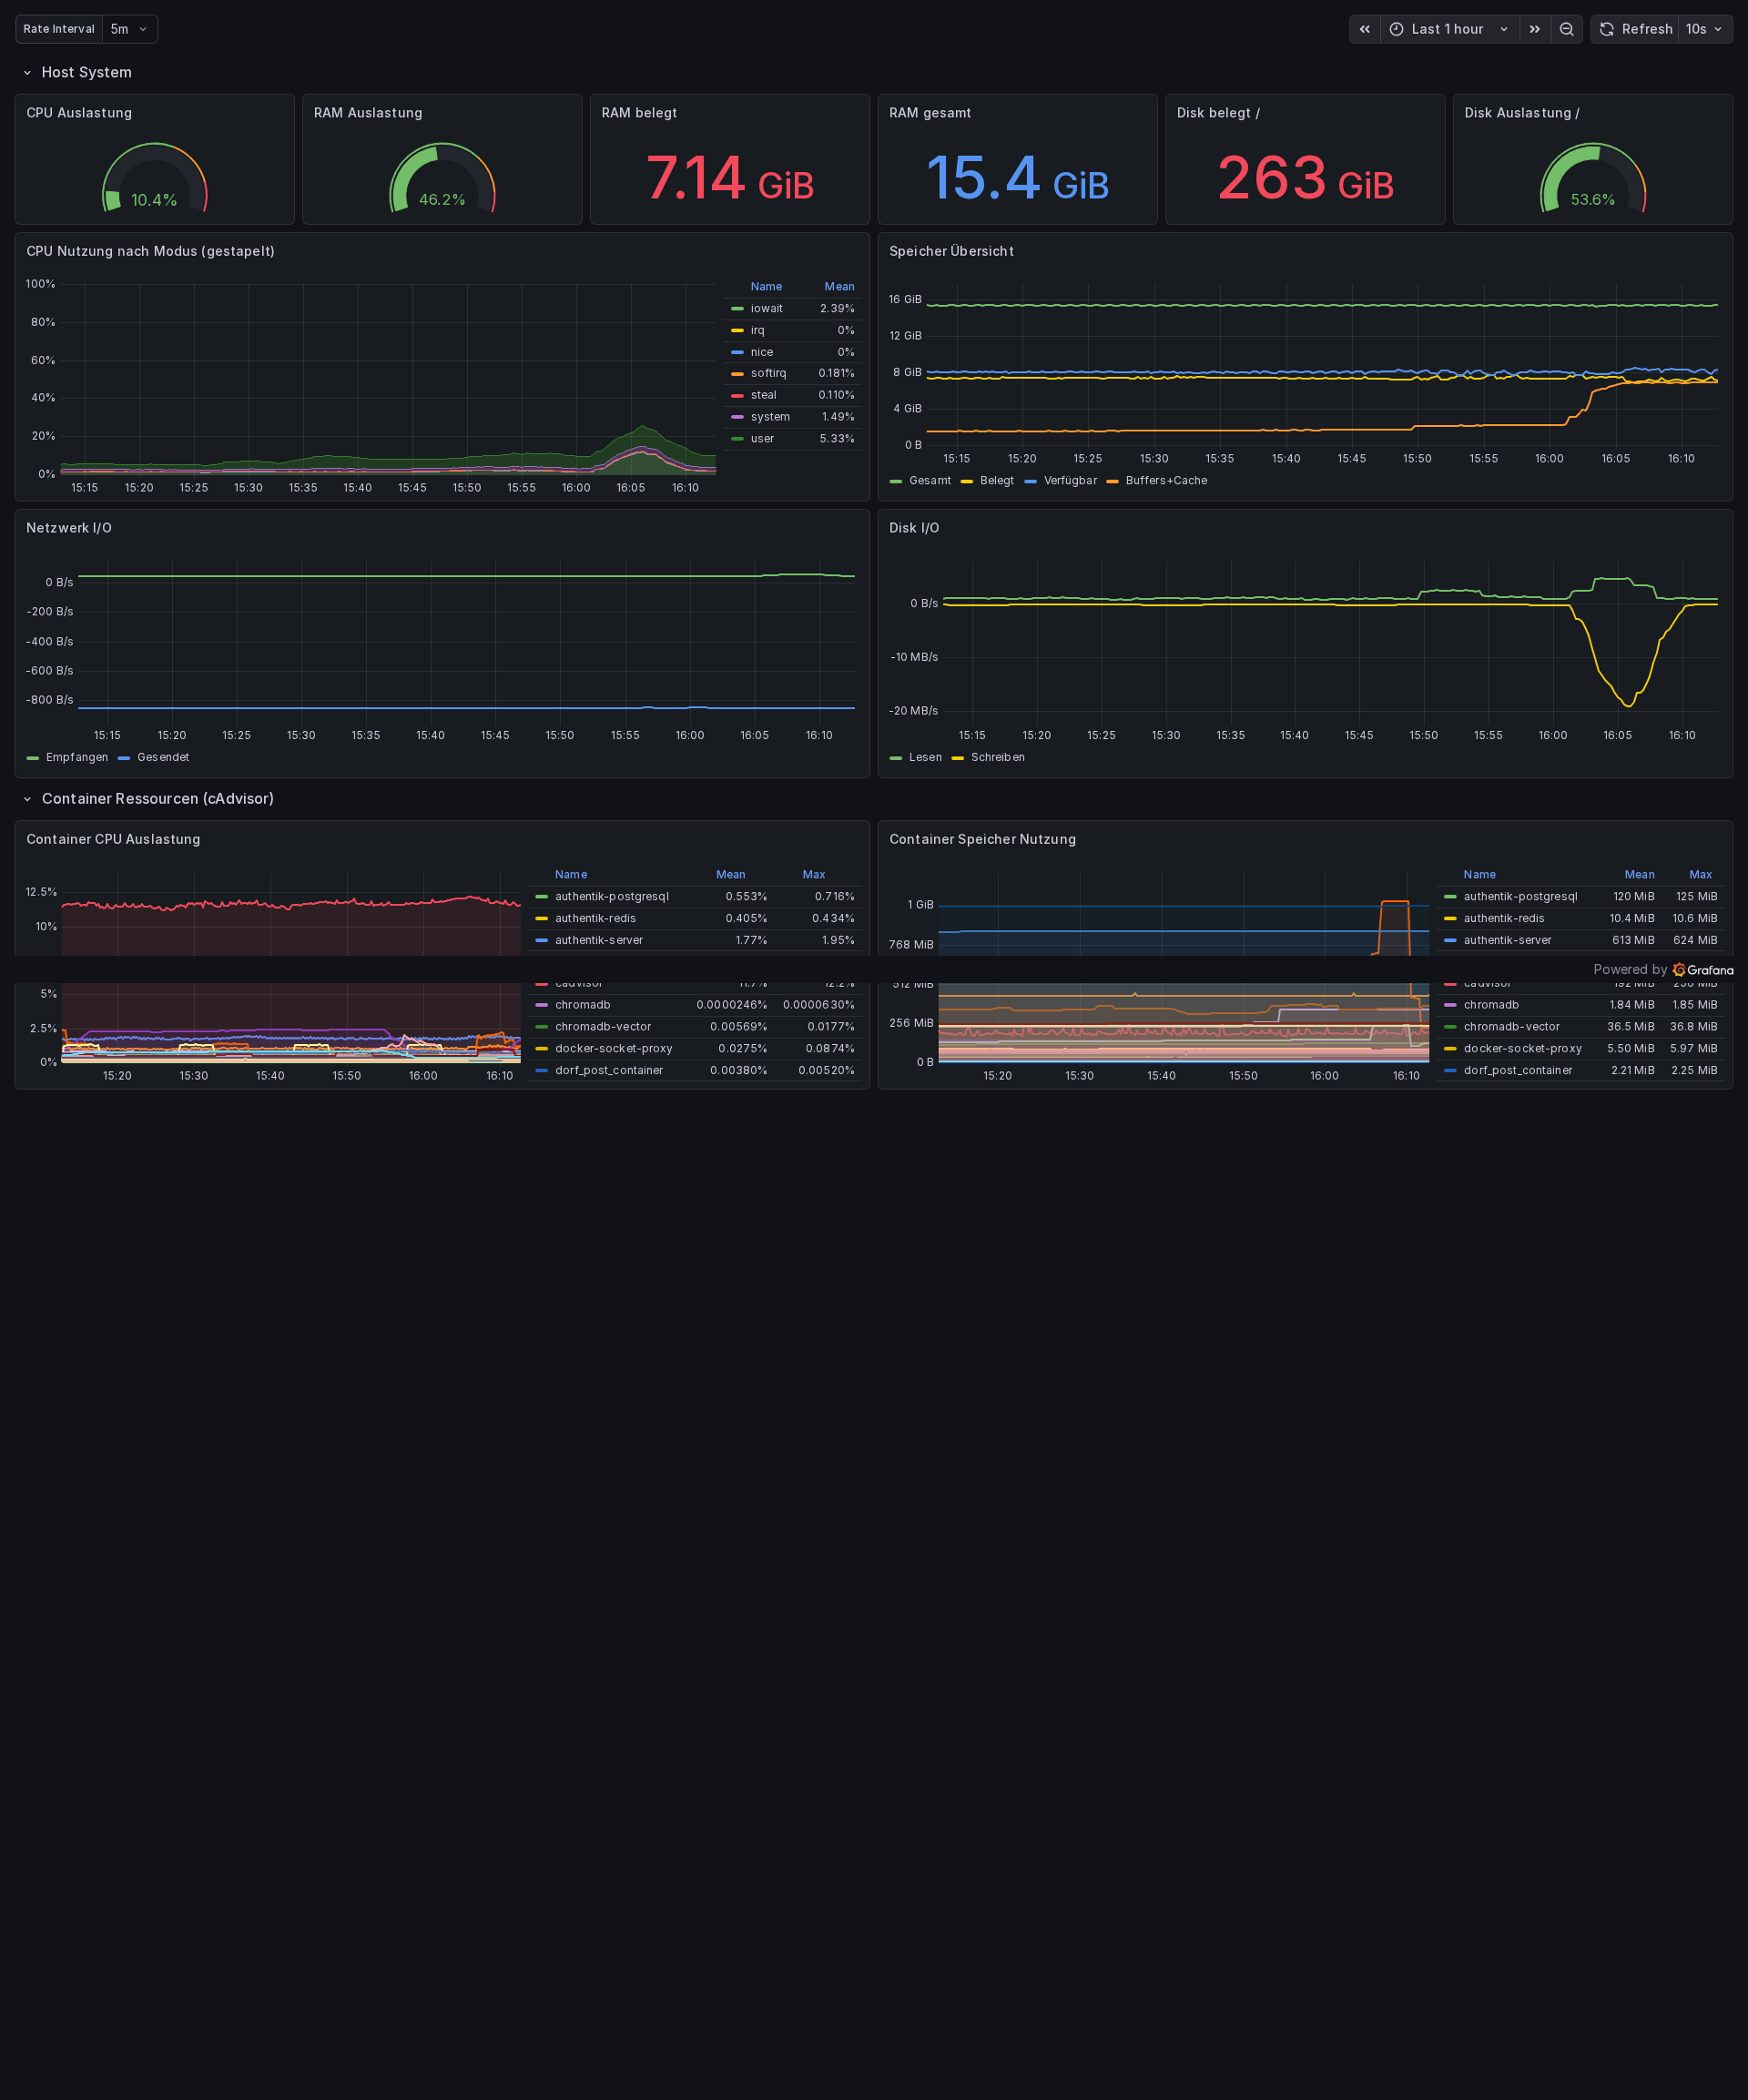
Grafana — Infrastructure & Resources
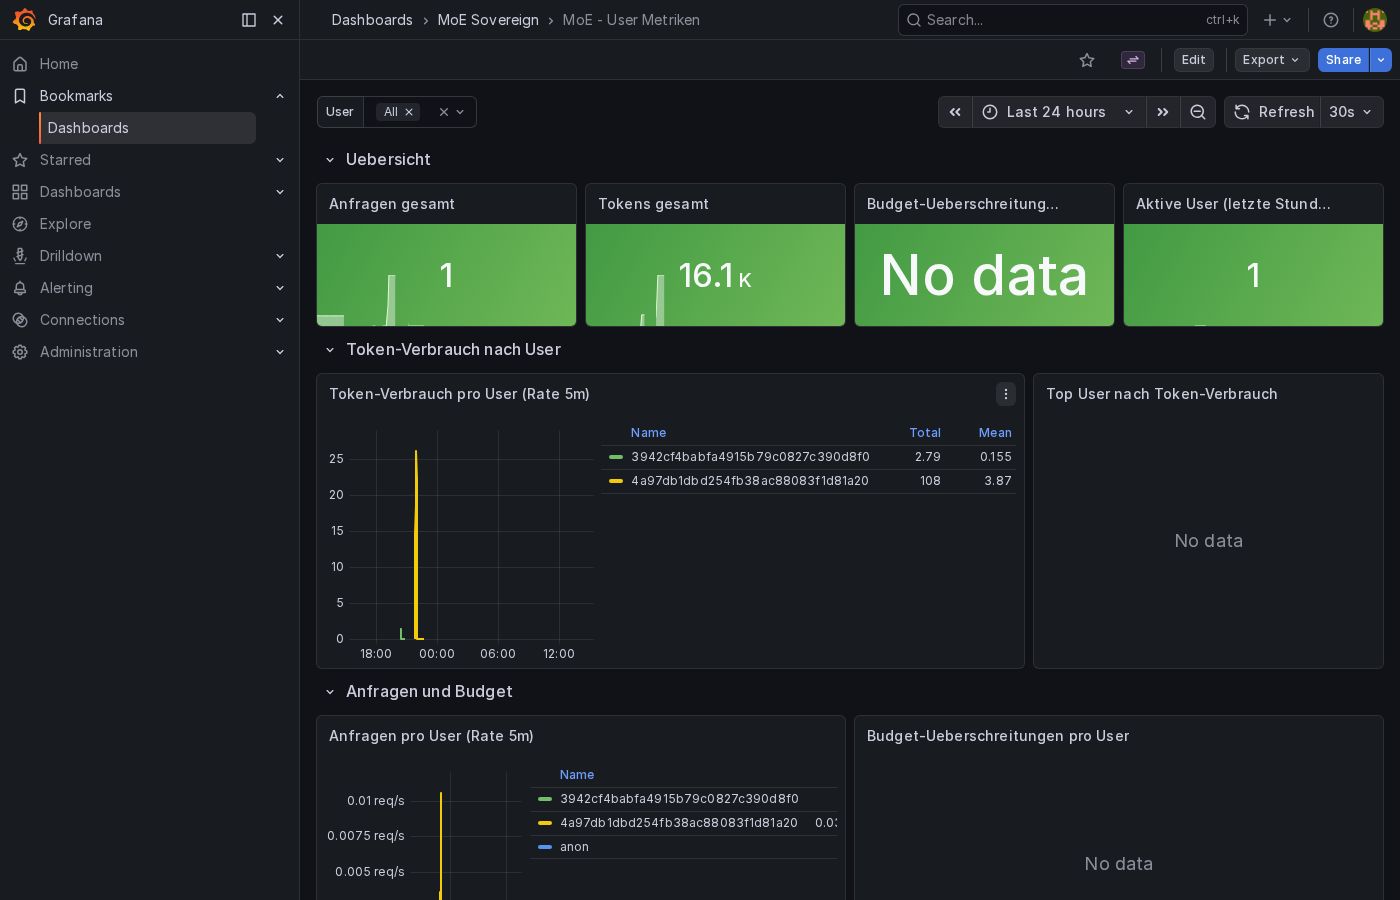
Grafana — User Metrics
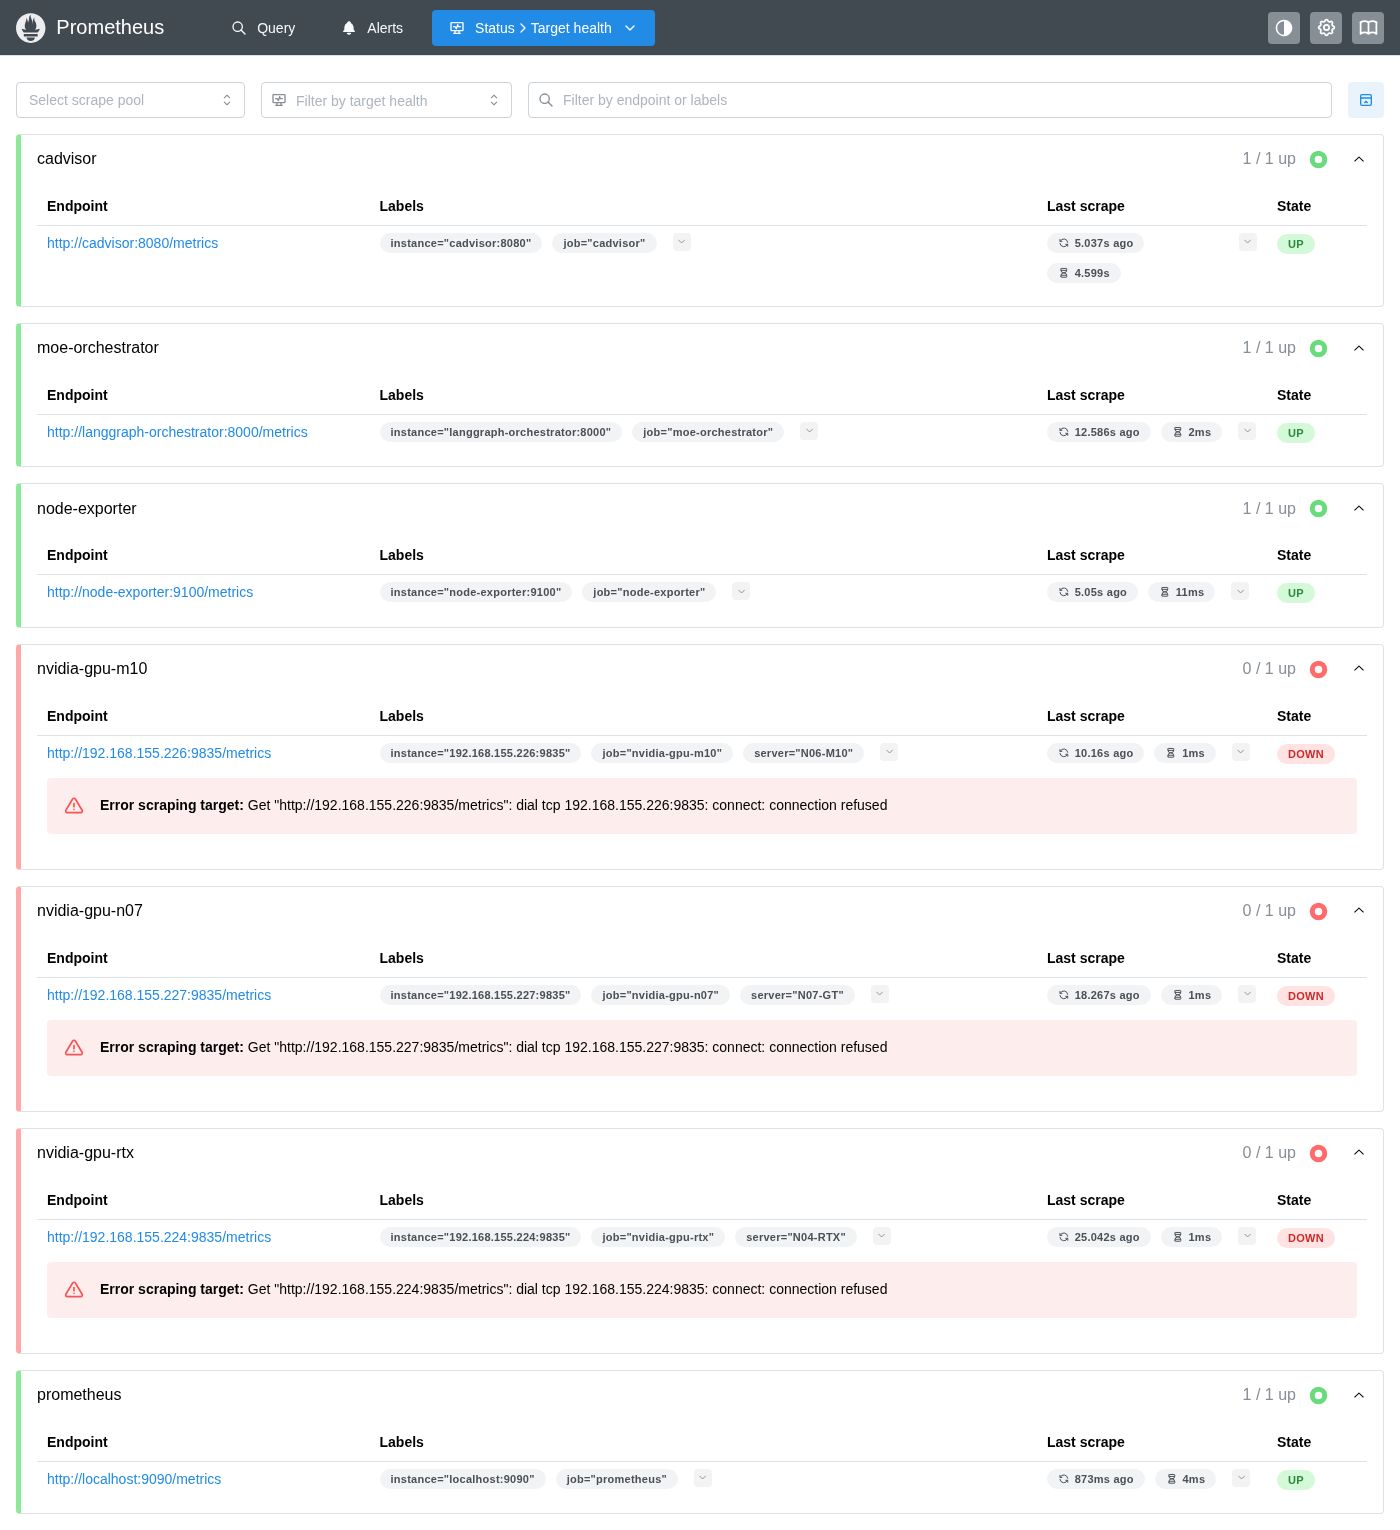
Prometheus — Scrape Targets
System Monitoring (/monitoring)
Provider Rate Limits
When Claude Code is active, this section shows the remaining API quota for each endpoint:
| Column | Description |
|---|---|
| Endpoint | Server/provider name |
| Remaining | Remaining tokens until next reset |
| Limit | Total limit |
| % | Usage as progress bar |
| Reset | Next reset time |
Color coding: Green (>20% remaining) · Yellow (<20%) · Red (exhausted)
System Gauges
Six real-time indicators for the state of the knowledge stack:
| Gauge | Metric | Description |
|---|---|---|
| ChromaDB Documents | moe_chroma_documents_total |
Number of vector documents in cache |
| Neo4j Entities | moe_graph_entities_total |
Nodes in knowledge graph |
| Neo4j Relations | moe_graph_relations_total |
Edges in knowledge graph |
| Ontology Entities | moe_ontology_entities_total |
Ontology concepts |
| Planner Patterns | moe_planner_patterns_total |
Learned routing patterns |
| Ontology Gaps | moe_ontology_gaps_total |
Topics not covered |
LLM Server Status
Compact overview of all configured inference servers:
- Online / Offline badge
- API type badge (Ollama / OpenAI)
- Latency (ms)
- GPU count
- Loaded models with VRAM usage (Ollama) or model count (OpenAI)
- Error message when offline
Hardware Metrics from Node Exporter
Each server status card also displays GPU, VRAM, RAM, and disk metrics
when a node-exporter instance
is reachable on port 9100 of the inference node's host. The Admin UI
derives the host IP from the Ollama URL and queries the /metrics endpoint
directly. GPU metrics (node_gpu_memory_used_bytes, node_gpu_memory_total_bytes,
node_gpu_utilization_percent) are expected from a textfile collector
(e.g., a cron job running nvidia-smi and writing to the collector directory).
Metrics Charts
All charts are queried via the Prometheus API (/api/monitoring) and rendered with Chart.js.
| Chart | Metric | Type |
|---|---|---|
| Token usage by model | moe_tokens_total (by model) |
Bar chart |
| Cache performance | moe_cache_hits_total / moe_cache_misses_total |
Donut |
| Expert calls by category | moe_expert_calls_total (by category) |
Bar chart |
| Expert calls by model | moe_expert_calls_total (by model) |
Bar chart |
| Expert calls by model & node | Grouped | Bar chart |
| Requests by mode | moe_requests_total (by mode) |
Donut |
| Confidence distribution | moe_expert_confidence_total |
Donut |
| Latency & scores | P50/P95, self-evaluation, feedback | Table |
Latency Metrics
| Metric | Formula |
|---|---|
| P50 (Median) | histogram_quantile(0.50, rate(moe_response_duration_seconds_bucket[1h])) |
| P95 (95th percentile) | histogram_quantile(0.95, rate(moe_response_duration_seconds_bucket[1h])) |
| Self-evaluation avg | moe_self_eval_score_bucket (avg) |
| User feedback avg | moe_feedback_score_bucket (avg) |
Live Monitoring (/live-monitoring)
Live Monitoring provides real-time insight into running processes with the ability to terminate individual requests.
Tab layout
flowchart TB
    P[/live-monitoring/]:::page
    P --> T1["Tab 1: Active Processes<br/>(badge = count)"]:::tab
    P --> T2["Tab 2: LLM Instances"]:::tab

    T1 --> R["Running API Requests<br/>(green/yellow/red by runtime)"]
    T1 --> K["Kill button<br/>per row"]
    T1 --> H["Process History<br/>up to HISTORY_MAX_ENTRIES"]

    T2 --> SC["Per-server cards"]
    SC --> LM["Loaded models<br/>(VRAM, quant, family, TTL)"]
    SC --> MC["Ollama Metrics<br/>(in-progress, queued, avg)"]
    SC --> AV["Available models<br/>(expandable list)"]

    classDef page fill:#eef2ff,stroke:#6366f1,font-weight:bold;
    classDef tab  fill:#f0fdf4,stroke:#16a34a;
All tab panes share the same 5-second polling loop but hit different REST endpoints:
| Tab | Endpoint | Data source |
|---|---|---|
| Active Processes — running | GET /api/live/active-requests |
Valkey SCAN moe:active:* |
| Active Processes — history | GET /api/live/history |
Valkey ZRANGE moe:admin:completed |
| LLM Instances | GET /api/live/llm-instances |
Direct HTTP fan-out to each configured inference server (/api/ps, /api/tags for Ollama; /v1/models for OpenAI-compatible) |
Tab: Active Processes
Running API Requests
Table of all currently running requests (auto-refresh every 5 seconds):
| Column | Description |
|---|---|
| Started | Request start time |
| Duration | Runtime in seconds |
| User | Username |
| Model | LLM in use |
| Mode | MoE mode (native, moe_reasoning, etc.) |
| Template | Expert template used (if set) |
| Type | streaming or standard |
| Client IP | Client IP address |
| Request ID | Unique chat ID |
| Kill | Button to terminate |
Color coding by runtime:
| Color | Runtime | Meaning |
|---|---|---|
| Green | ≤ 30s | Normal |
| Yellow | ≤ 120s | Longer than usual |
| Red | > 120s | Potential timeout |
Killing a Process
sequenceDiagram
    actor Admin
    participant Browser as Admin UI<br/>(live_monitoring.html)
    participant Backend as admin_ui/app.py
    participant Valkey as Valkey<br/>moe:active:*
    participant Orch as Orchestrator<br/>main.py
    participant Client as API client

    Admin->>Browser: click "Kill"
    Browser->>Browser: confirmation dialog
    Browser->>Backend: POST /api/live/kill-request/{chatId}
    Backend->>Valkey: DEL moe:active:{chatId}
    Backend->>Valkey: ZADD moe:admin:completed status=killed
    Backend-->>Browser: 200 OK
    Orch->>Valkey: GET moe:active:{chatId}  (next checkpoint)
    Valkey-->>Orch: nil → abort
    Orch-->>Client: StreamingResponse closes
    Browser->>Backend: GET /api/live/active-requests  (next poll)
    Backend-->>Browser: row gone
What happens on kill:
- The Valkey key
moe:active:{chatId}is deleted - The request is moved to
moe:admin:completed(Sorted Set) with statuskilled - The running LangGraph node receives the kill signal on the next checkpoint
- The client receives an abort error
Streaming Requests
For streaming requests, it may take a few seconds for the kill command to take effect (at the next LangGraph checkpoint).
Process History
Table of all completed requests (up to HISTORY_MAX_ENTRIES, default: 5000):
| Column | Description |
|---|---|
| Started | Start time |
| Ended | End time |
| Duration | Total runtime |
| User | Username |
| Model | LLM |
| Mode | MoE mode |
| Type | streaming / standard |
| Status | completed (green) or killed (red) |
Use the "Clear History" button (top right in the history panel) to delete the entire history from Valkey.
The history limit can be configured via environment variable:
Tab: LLM Instances
Detailed status of all inference servers:
Per Server (Ollama)
Loaded Models:
| Column | Description |
|---|---|
| Model | Model name:tag |
| VRAM | Currently used VRAM (MB) |
| Total | Total model size (MB) |
| Parameters | Parameter count |
| Quant. | Quantization level |
| Family | Model family |
| Expires | When the model will be unloaded from VRAM |
Ollama Metrics (chips):
| Metric | Meaning | Alert |
|---|---|---|
| In Progress | Current requests | Red if > 0 |
| Queued | Queue length | Red if > 0 |
| Loaded | Number of loaded models | – |
| Total Requests | Lifetime requests | – |
| Avg / Request | Average duration | – |
| ↑ Input | Request size (MB) | – |
| ↓ Output | Response size (MB) | – |
Available Models (expandable):
All installed models with name, size (GB), parameter count, quantization.
Per Server (OpenAI-compatible)
- Model count
- Available models (list)
Refresh Controls
| Element | Function |
|---|---|
| Last Updated | Timestamp of last query |
| Refresh manually | Immediate query |
| Auto 5s ☑ | 5-second polling (default: active) |
Prometheus Metrics – Full List
| Metric | Labels | Type | Description |
|---|---|---|---|
moe_tokens_total |
model, token_type, node, user_id | Counter | Processed tokens |
moe_expert_calls_total |
category, model, node | Counter | Expert invocations |
moe_requests_total |
mode | Counter | Requests by mode |
moe_response_duration_seconds |
– | Histogram | Response times |
moe_cache_hits_total |
– | Counter | Cache hits |
moe_cache_misses_total |
– | Counter | Cache misses |
moe_expert_confidence_total |
level | Counter | Confidence distribution |
moe_self_eval_score_bucket |
le | Histogram | Self-evaluation scores |
moe_feedback_score_bucket |
le | Histogram | User feedback scores |
moe_chroma_documents_total |
– | Gauge | ChromaDB documents |
moe_graph_entities_total |
– | Gauge | Neo4j entities |
moe_graph_relations_total |
– | Gauge | Neo4j relations |
moe_ontology_entities_total |
– | Gauge | Ontology entities |
moe_planner_patterns_total |
– | Gauge | Planner patterns |
moe_ontology_gaps_total |
– | Gauge | Ontology gaps |
All metrics are also directly accessible via Prometheus (http://localhost:9090) and Grafana (http://localhost:3001).